You are using an out of date browser. It may not display this or other websites correctly.
You should upgrade or use an alternative browser.
You should upgrade or use an alternative browser.
peterpr
Established member
- Messages
- 609
- Likes
- 7
kriesau said:...........................................................................................................................................................................
Don't understand your point about the absence of a zero line. There is a zero base on his chart with commercial hedgers at 0.70 and large specs and small traders between 0.1 and 0.2.
I guess that's what is intended, but the lines run remarkably congruent to my bar chart so .....
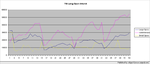
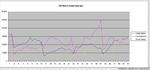
I've D/L'd the COT's CSV data and charted in Excel. - 2 charts attached.
The first is the net LONG positions of the 3 categories. The second the short positions. Again, the first looks remarkably like both U's chart and my original bar chart.
Can't spend much (if any) more time on this but Subtract the short line values from the long line values and you have the current net position for each category - with a large net long for the commercials, a broadly evens position for the large specs and Small specs heavilly short
Attachments
roguetrader
Senior member
- Messages
- 2,062
- Likes
- 49
LOL judging by the activity on the chart in 2001 users description that accompanied his chart makes sense, I am just confused by the scale on the left side as to what it represents.
counter_violent
Legendary member
- Messages
- 12,672
- Likes
- 3,788
Glad that's all cleared up !!!.......now back to coin flipping 😈
............................................................................................................................................................................Whats cleared up ??counter_violent said:Glad that's all cleared up !!!.......now back to coin flipping 😈
We still have two diametrically opposed interpretations from User and Peterpr on the Shorts Chart !
counter_violent
Legendary member
- Messages
- 12,672
- Likes
- 3,788
kriesau said:............................................................................................................................................................................Whats cleared up ??
We still have two diametrically opposed interpretations from User and Peterpr on the Shorts Chart !
Fancy .....cracking a joke and it's not even April the first !!!
User
Experienced member
- Messages
- 1,170
- Likes
- 23
The chart I posted shows future short positions from three sets of investors:
Commercial hedger
Large speculator
Small trader
The chart posted does not show long positions and ONLY shows short positions.
'Commercial hedgers (smart money) have the highest short positions in Dow Jones futures since the introduction of this financial derivative. The last time they had such high short positions was near the market top in 2000. Commercial Hedgers hold a significant informational edge over other traders as far as fundamental supply-and-demand statistics are concerned. They tend to be early, but they are usually right on the long run, quite contrary to the small traders. Extreme divergences in long and short positions of small traders and commercial hedgers have proven to be reliable indicators of important trend changes. In such cases it is not advisable to bet against the commercial hedgers. Small traders (dumb money) do not only have the lowest short positions ever right now, their long/short ratio (long positions divided by short positions) is also unprecedented and extremely bearish.'
I hope this helps. Tha charts shows exactly what I have stated.
..........................................................................................................................................................................counter_violent said:Fancy .....cracking a joke and it's not even April the first !!!
Whats the joke - let us all in on your humour ?
..........................................................................................................................................................................user said:The chart I posted shows future short positions from three sets of investors:
Commercial hedger
Large speculator
Small trader
The chart posted does not show long positions and ONLY shows short positions.
'Commercial hedgers (smart money) have the highest short positions in Dow Jones futures since the introduction of this financial derivative. The last time they had such high short positions was near the market top in 2000. Commercial Hedgers hold a significant informational edge over other traders as far as fundamental supply-and-demand statistics are concerned. They tend to be early, but they are usually right on the long run, quite contrary to the small traders. Extreme divergences in long and short positions of small traders and commercial hedgers have proven to be reliable indicators of important trend changes. In such cases it is not advisable to bet against the commercial hedgers. Small traders (dumb money) do not only have the lowest short positions ever right now, their long/short ratio (long positions divided by short positions) is also unprecedented and extremely bearish.'
I hope this helps. Tha charts shows exactly what I have stated.
Thanks User - the confirmation of your original point is really helpful 🙂
peterpr
Established member
- Messages
- 609
- Likes
- 7
user said:The chart I posted shows future short positions from three sets of investors:
Commercial hedger
Large speculator
Small trader
The chart posted does not show long positions and ONLY shows short positions.
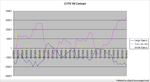
Same categories in mine. But - the problem with only showing the short side is that each category could also have LARGER positions the opposite way - Its the NET position of each that tells the real story.
No dispute about the smart/dumb money thing just precisely what is the NET position of each category right now.
My chart shows that the Commercials are net LONG by a big margin right now. There are 39 of them with reportable positions. Most are clearly long. There are 74 Large Specs with reportable positions - they are net short but the balance is less one-sided. The remainder are small specs and they are heavilly net short.
Here is an Excel chart of the data that I've cobbled together from the CSV series.
BTW - my chart only show 1 year - U's go back to 1998 - so any 'congruence' or lack of it was coincidental - missed that - sorry!
That's me lot on this little matter - must get some real work done ! Unless anyone has a burning question/observation that is
Attachments
roguetrader
Senior member
- Messages
- 2,062
- Likes
- 49
Would be interesting to know what the scale on the left side of users chart meant ie what is 0.8?
peterpr
Established member
- Messages
- 609
- Likes
- 7
roguetrader said:Would be interesting to know what the scale on the left side of users chart meant ie what is 0.8?
I originally (hastily) thought is was fractional representation of thousands because the highest point chimed nicely with the total of 80,000 or so o/s contracts. However, I think it's intended to be 0 - 1, so that for any drawn vertical line the sum of each category's value is 1.
BUT - it still shows only the SHORT position for each category, which is pretty meaningless when they could each have opposite positions from zero to mega millions
OK individuals cannot take opposite positions - against the rules BUT the individuals making up a category can - and pretty well always do. So what's the point of a shorts only COT chart I'd like to know?
peterpr
Established member
- Messages
- 609
- Likes
- 7
Hey --- I'm not saying go long on the strength of the COT's position.lemput said:i'm going with peterpr... sorry user it makes more sense! your long so what does it matter. you'd like him to be right!!!!!!!!
Just that - on balance - I believe we will see further upside before the crunch (crash ??) that I think is not so far away - and that any further immediate move down will be limited - say 10740 ish. I'll certainly watch for the COT report like a hawk on Friday though
User
Experienced member
- Messages
- 1,170
- Likes
- 23
Guys its not really a competition. Go too Dow competition for a contest. This is just to get your views accross.
I'm short term long but hoping to get in short for the longer term very soon.
Major resistance at 10850-70 area so rudeboy your right in having that point as a target.
Lemput as long as your making money it doesn't really matter how you interpret information, does it?
Wheres FC today?
I'm short on oil again at 5420. Went short on currencies last night, not doing badly in that market!
As for the Dow, it just seems to be a little lethargic. 10800 is short term resistance.
Similar threads
- Replies
- 1
- Views
- 4K
- Replies
- 1
- Views
- 5K