wallstreet1928
Legendary member
- Messages
- 6,609
- Likes
- 89
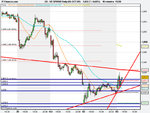
2nd target hit on oil ...S1
3rd target 50 MA
SP500 will find support at 1028 in the interim, but wont last long
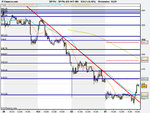
dollar index...keep an eye on this trendline
it can cause liquidation in oil
i have been shorting oil all morning ............waiting for pull back before going short again
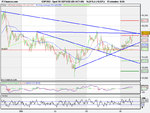
FTSE latest 10 min chart
KEY level 4997
> 4997 .....target 5017
< 4997 ..... target 4956
1035 resistance level on SP500
5017 resistance level on FTSE
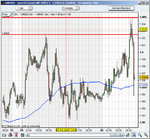
Asscending Triangle on 15M Cable Chart.
Fake out before the news, almost to be expected!
yep, sucking in those longs. i was short at 1.604
i was considering it but it would have been 90% punt 10 % luck!
The risk upside was 30-35 pips depending on entry but it is not a set up i trade.
Good morning all
can someone please quickly explain to me how you amend the data on IG index real time charts from line to candlesticks
FTSE Short 5070. 15 SL.
Resistance on the hourly, RSI hitting 70. Upper Bollinger and 200 MA lurking above.
🙂