Wallstreet1928 Analysis & live calls on FTSE,DAX,S&P...aimed to help New traders

Status
Not open for further replies.
FTSE hourly chart with MACD histogram. Look at the move of the price in previous few Green histogram (ie, price at start of green and end of green). Compare it to the red histogram's price range. This seems to be recoiling for another bounce.
 
What's your principle/strategy mate? Unless you dont want to reveal millionaire's secret :)
Im more than happy to discuss with you. i guess thats what this forum is for, is to help everyone make money. i look at a combination of MACD, RSI and stochastics, on a 5min TF. If you look at 2.15pm you see the that all 3 measures were in oversold area, and that the stochstics were turning. Once I see RSI and Stochastic moving up, and then that is confirmed with MACD crossing up, I see that as a buy signal. It can run out of steam very quickly sometimes but usually there is enough to get out of the trade quickly with a small loss or profit. I move my stops up fairly quickly as well. This is done with a general feel for the tone of the market and what prices are doing relative to the Pivot Point and Res and Supp levels. This works for overbought as well. It has taken me about 6 months to get to this point but it appears to work for me at the moment. The same trade set up would have worked at 9.55 as well, but the bid/offer out of hours on the DOW with Fispreads is 6 points, so i wait until the US opens. i like the DOW because you do get more extreme moves. Hope you find this of interest and i welcome anyone elses views on this methodology.
 
Btw folks, I am signing up on knowledge to action's training of 2 days + ongoing support, their strategy and signaling software costs. In total, it is a onetime 2k. Any of you had experience, then pls let me know.

give me £2k and I will give you better signals ...........haha!!

don't waste money on these silly programmes, if they were so successful why sell them.

I am an old school veteran, I believe in utilising your brain.....not the computer chip!!

Man V Machine ..........
 
sorry mate. forgot.

Do ITMS guys discuss FTSE in their members area as well? Your target was spot on resistance zone. You had it charted from a S/R a year ago? or did ITMS guys laid it out?

they only discuss the US market, but their principles/methodology are universal
 
london lad, check out INO for signalling software videos. They sometimes give out free tips and explain how their software works to try and give you an advantage

They called silver at about 14 dollars I believe, fres was a good bet on that several times recently

$16.5 was a big number for SLV apparently so see if it can stay above this or not. I wonder if a fancy share sell order could trigger off a commodity price, I bet somewhere does that
http://img10.imageshack.us/img10/2145/slvbigchart.gif

Took some charts of Fres and silver and drew some lines

http://img225.imageshack.us/img225/4443/silverv.jpg
http://img248.imageshack.us/img248/407/25013413.png
http://img12.imageshack.us/img12/720/fres.png
 
oil no longer bearish

no more lower highs on 1 HR

1st hurdle $73.5
 

Attachments

  • US Light Crude (OCT-09).png
    US Light Crude (OCT-09).png
    20.2 KB · Views: 121
give me £2k and I will give you better signals ...........haha!!

don't waste money on these silly programmes, if they were so successful why sell them.

I am an old school veteran, I believe in utilising your brain.....not the computer chip!!

Man V Machine ..........

Got to agree with WS here , about saving your 2K (not the terminator stuff ;);) )

There's only one way your going to do this, and that's screen time infront of the charts.
 
Based on my previous posts on my trading methodology I think the DOW is pointing to an uptick soon. i am watching and will let you know if I trade. At the moment I havn't seen an uptick in the Stochatics and the MACD is still heading south which why i am hesitating. Repeat to myself, "if the signs aren't perfect dont trade beacuse you will lose money. Wait until they are perfect...."
 
Why 19.45pm?

In my experience when the fast money starts to make a move it moves just before the last hour - indeed as I write there is a semblance it is happening already.

I find that trade moves in the last hour tend to be more reflective of people jumping on to trends rather than changing trends - it's not exact by any means just seems to me to be a higher probability.

Like I said it is just a hunch.

BTW if there is a sell-off I would expect a bounce back tomorrow FWIW IMHO subject to external factors as ever.... in other words ignore all I say and follow the system that works for you :)
 
finally a break out

beautiful topping pattern - double top

I hope everybody caught that?
 

Attachments

  • US SPX500 Daily (17-SEP-09).png
    US SPX500 Daily (17-SEP-09).png
    19.8 KB · Views: 126
Last edited:
Re: TF's Geo , I use pretty much the standard stuff.

use Daily chart (along with weekly) to try and determine what the possible moves are going for the next few bars (anything longer than that I need to see how things are developing as we go along).

Tend to use time and price stuff for this (You've seen my charts before , with the exception of time that's how I set them up) . I don't want to use daily setups because of the size of risk you need to take on.

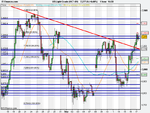
So once I have an idea of what I'm looking to do for next few days, I'll then watch the 60min for setups (Again I'll use time&price, 60Min is the lowest TF in which I use time on the FTSE, below that its all price (for Forex, daily is the lowest, everything lower is just price)) when I think I see a setup starting to develop, I'll watch the 10M chart to find a entry/trigger into the 60M setup, this allows me to keep control of risk. If things work out I've got myself daily trades (1 day to possibly a couple of weeks) with 10m bar setup risk. If I'm wrong I'll resort to shouting :)

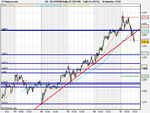
Forex is slightly different in that I use H4 for setups with H1 for triggers , although I'll try to refine triggers further by using 15M (prefer not to enter trades on H1 bars, again due to the risk size sometimes)

FTSE : Setups H1 (8.5 bars/day) : Triggers 10M (27/Day)

Forex : Setups H4 (6/day) : Triggers 1H (24/day)

Thanks for your answer Mas.

It makes me think I will start looking at the dailies everyday, instead of occasionally, and start using 4h instead of 3h for direction. As I was saying to the lapster ( as we both use h3 ), we are potentially in a little h3 bubble, which could be bad!

Which timing method do you use btw? I have used fib 1.618 expansions in the past, and also I've used Lucky 21 as per HWSTeele's timing forum. I prefer Lucky 21's, they seem to work very well most of the time, if used in conjunction with PA for signals.
 
I have been watching another thread 'Indicators are liars' - there is a lot of data produced by aamarx but I think it is very helpful in the grand scheme of things. I set my stop on the S&P Dec 09 short a few points above his high resistance line as posted today. If you haven't seen it there may be some interest to folks here.
 
Status
Not open for further replies.
Top