You are using an out of date browser. It may not display this or other websites correctly.
You should upgrade or use an alternative browser.
You should upgrade or use an alternative browser.
Wallstreet1928 Analysis & live calls on FTSE,DAX,S&P...aimed to help New traders
- Thread starter wallstreet1928
- Start date
- Watchers 252
- Status
- Not open for further replies.
wallstreet1928
Legendary member
- Messages
- 6,609
- Likes
- 89
Wallstreet, you're back! Good to see you - I had missed your analysis!
Hope your wife is recovering well.
thank you for asking my friend
My wife was allowed to come home yesterday and she just needs time to recover now
and yes my mind is much clearer now........my trading judgement has been all over the place lately!!
stress, stress, stress..........but it has all subsided!!
Geofract
Experienced member
- Messages
- 1,483
- Likes
- 112
Is Eyield worth doing, does it offer good value for money?
This is my opinon Bennie - I'm a confirmed noob though, so take it all with a pinch of salt!
http://www.trade2win.com/boards/uk-...-ftse-dax-s-p-aimed-help-new-traders-329.html
SabreTT
Active member
- Messages
- 172
- Likes
- 4
They are making a new wallstreet film I heard btw
There is no golden rule but every stage of the day has its influences I guess
Footsie sells its mornings' gain each and everytime.
There is no golden rule but every stage of the day has its influences I guess
SuddenDeath
Legendary member
- Messages
- 14,063
- Likes
- 143
anyone here consider protecting trades using options rather than stops ?
bottomleyp
Member
- Messages
- 90
- Likes
- 4
Anglo American 1605 ...............big number !!
good trade if anyone interested!!
if > 1605 with conviction then 200 day MA next target
if < 1605 then nice short to 1545 and below
What time frame for the 200ma
According to IG,it is about 1640 ish on Daily.
Does that agree with your analysis ?
karlandree
Junior member
- Messages
- 27
- Likes
- 0
thank you for asking my friend
My wife was allowed to come home yesterday and she just needs time to recover now
and yes my mind is much clearer now........my trading judgement has been all over the place lately!!
stress, stress, stress..........but it has all subsided!!
Really glad all is well with your wife Wallstreet which on the other hand leads you back here.:clap:
SabreTT
Active member
- Messages
- 172
- Likes
- 4
anyone here consider protecting trades using options rather than stops ?
Sure but Ive not a clue how to value them properly tbh
Heres an options chart, let me know where my stop is 😆

newward
Junior member
- Messages
- 39
- Likes
- 0
What kind of formulae are you using to ensure you have accurate delta/gamma ?
anyone here consider protecting trades using options rather than stops ?
SuddenDeath
Legendary member
- Messages
- 14,063
- Likes
- 143
I saw an interesting video on youtube......
http://www.youtube.com/watch?v=vRHu2Uqb0Pg&feature=channel_page
this video shows an interesting way to trade with low risk.
What kind of formulae are you using to ensure you have accurate delta/gamma ?
http://www.youtube.com/watch?v=vRHu2Uqb0Pg&feature=channel_page
this video shows an interesting way to trade with low risk.
SuddenDeath
Legendary member
- Messages
- 14,063
- Likes
- 143
good night everyone have a nice weekend
Im of the opinion the market will sell of a little on sundays open into monday, as the dow seemed to hang around 8540 ish most of the day and failed to make any significant rally near the close, also people taking profits and nothing of significance from the foxex factory calender.
im short at 8551 .
Any views?
im short at 8551 .
Any views?
francisfinley
Established member
- Messages
- 902
- Likes
- 46
guys/gals, i am currently trialing some spreadbet vendors...
http://www.trade2win.com/boards/spr...rs-i-am-currently-trialing-good-platform.html
gft dealbook web is awesome & 1 pip spread. if you are still using a 2pip spread broker STOP!
(not affiliated with GFT)
http://www.trade2win.com/boards/spr...rs-i-am-currently-trialing-good-platform.html
gft dealbook web is awesome & 1 pip spread. if you are still using a 2pip spread broker STOP!
(not affiliated with GFT)
wallstreet1928
Legendary member
- Messages
- 6,609
- Likes
- 89
Good weekend everyone
just got back from cricket
we beat Bowdon after bowling them all out for 125 ...but my thumb is really sore after a drop catch in slip!! Ouch..........
Anyway back to my weekend Analysis
as always i highly recommend watching Inthemoneystocks videos
http://www.youtube.com/user/inthemoneystocks?gl=GB&hl=en-GB
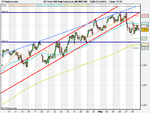
Nasdaq analysis
2 yr chart ................ neck-tie of 200 & 20 MA will be solid support @ 1370, if broken then next level 1300's.............If held then 1460 above here we come!!
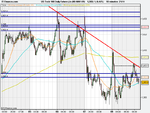
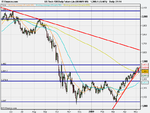
1 yr chart - uptrend seams to have run out of steam .......red trend line indicating it, next level 1370!!
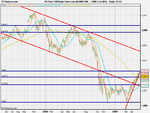
3 month, 4 hrs - this time frame also confirms the break out on the downside to 50 MA which coincides with 1370 again(interesting) , Nasdaq leads the S&P so I would also make the assertion that 930 is the high for S&P and we are heading southwards for now??
1 month , 1 hr - bearish again - red trendline channel depicts breakout on the down side , target of 1360 , 200 MA .......
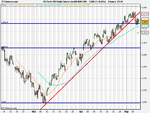
1 week , 10 min - red trend line apparent ........beautiful short opportunities on every occasion
conclusion = short market .............downward targets of 1370 initially, if broken then 1360 - 1350 - 1340 !!
the leader is failing............So its followers shall also show signs of weakness
lets move onto the S&P
just got back from cricket
we beat Bowdon after bowling them all out for 125 ...but my thumb is really sore after a drop catch in slip!! Ouch..........
Anyway back to my weekend Analysis
as always i highly recommend watching Inthemoneystocks videos
http://www.youtube.com/user/inthemoneystocks?gl=GB&hl=en-GB
Nasdaq analysis
2 yr chart ................ neck-tie of 200 & 20 MA will be solid support @ 1370, if broken then next level 1300's.............If held then 1460 above here we come!!
1 yr chart - uptrend seams to have run out of steam .......red trend line indicating it, next level 1370!!
3 month, 4 hrs - this time frame also confirms the break out on the downside to 50 MA which coincides with 1370 again(interesting) , Nasdaq leads the S&P so I would also make the assertion that 930 is the high for S&P and we are heading southwards for now??
1 month , 1 hr - bearish again - red trendline channel depicts breakout on the down side , target of 1360 , 200 MA .......
1 week , 10 min - red trend line apparent ........beautiful short opportunities on every occasion
conclusion = short market .............downward targets of 1370 initially, if broken then 1360 - 1350 - 1340 !!
the leader is failing............So its followers shall also show signs of weakness
lets move onto the S&P
Attachments
Last edited:
bottomleyp
Member
- Messages
- 90
- Likes
- 4
Good weekend everyone
just got back from cricket
we beat Bowdon after bowling them all out for 125 ...but my thumb is really sore after a drop catch in slip!! Ouch..........
Anyway back to my weekend Analysis
as always i highly recommend watching Inthemoneystocks videos
http://www.youtube.com/user/inthemoneystocks?gl=GB&hl=en-GB
Nasdaq analysis
2 yr chart ................ neck-tie of 200 & 20 MA will be solid support @ 1370, if broken then next level 1300's.............If held then 1460 above here we come!!
1 yr chart - uptrend seams to have run out of steam .......red trend line indicating it, next level 1370!!
3 month, 4 hrs - this time frame also confirms the break out on the downside to 50 MA which coincides with 1370 again(interesting) , Nasdaq leads the S&P so I would also make the assertion that 930 is the high for S&P and we are heading southwards for now??
1 month , 1 hr - bearish again - red trendline channel depicts breakout on the down side , target of 1360 , 200 MA .......
1 week , 10 min - red trend line apparent ........beautiful short opportunities on every occasion
conclusion = short market .............downward targets of 1570 initially, if broken then 1360 - 1350 - 1340 !!
the leader is failing............So its followers shall also show signs of weakness
lets move onto the S&P
Glad to here about your wifes recovery, I bet that brings great relief.
Back to your analysis - short market downward target 1570 initially, do you mean 1370
as IG quotes US tech at 1388 now
- Status
- Not open for further replies.
Similar threads
- Replies
- 72
- Views
- 21K
- Replies
- 21
- Views
- 8K