Da.DesiTrader
Well-known member
- Messages
- 472
- Likes
- 3
Guys anyone know , how to use Trend and Confidence line using IG's advance charts?
Last edited:
Geofract .................what is you H4 Bias on EURO?
has it stalled on the long side?
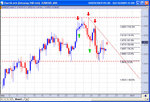
I have a unfilled gap to 1.4680 WS.
yes I can see that but it is showing as 1.4690 on my charts
also there is a great disparity between CMC markets and IG Index at present
CMC 1.4697 - 99
IG 1.4687 - 89
Strange?
I am long EURO ...1.4699 ...stop loss 1.4669
target 1.4729
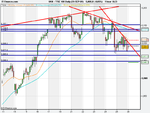
lower lows on hourly ....from 1.465 ....
head and shoulder confirmed once 1.475 fails
then short this chap all the way down ......
but H &S not good for equity market as it will signal huge sell off there ......
I am long oil 65.63 ...stop loss 65.33
67