Wallstreet1928 Analysis & live calls on FTSE,DAX,S&P...aimed to help New traders

Status
Not open for further replies.
Morning all,
Great recovery from SP500 yesterday, ouside day going up is bullish signal.
expecting markets to make a new high today so I stay long SP500, moved target to 1039.

FTSE making new high as predicted. SP500 will follow.
 
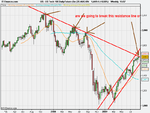
my charts have the FTSE for an up day 2moro, so i'm hoping this will be a pullback in a continuing up T.

although this still hasn't helped the rather ugly dog shaped equities i'm holding at the mo, glad i only took small positions with these two little munters :cheesy:

(DISL) + (RGM)

looks like a couple of my swing trades have rather un-magically turned into *cough* 'investments' :whistling
 
All through the lunch break, that sideways movement. the averages on the 30M chart remained very strong. I could see no reason to be short at that time. I took 16 points after lunch, but have closed now. I've had enough for today.

No one can tell whether a resistance line will hold, or not. I just get in, watch the average for direction and keep as close an eye on it as possible.

I didn't have an excellent ,morning, though. I got into a pullback too late to get any decent profit out of it.
 
You say the optimum SL is 20-30 points, do you target 60 then in a 1:2 because the FTSE only averages about 80-90 a day at present
 
FREE CALL CURRENCY>>buy usd/jpy at 9353 sl 9320 tgt 9394-9430or
sell usd/jpy at 9449 sl 9479 tgt 9389-9349(do the call which hits entry 1st n cancel the other one)

hope this helps someone here atleast :)

buy at 9354 executed. Your pipeline for potential clients increased by 1. Will you give sell signal on this as well?
 
Sujith what's your opinion on this my friend?

do you trade the Nasdaq ?


Nasdaq 1660

what is going to happen

2 year weekly chart ?
 

Attachments

  • US Tech 100 Daily Future (Se (28-AUG-09).png
    US Tech 100 Daily Future (Se (28-AUG-09).png
    21.5 KB · Views: 125
Sujith what's your opinion on this my friend?

do you trade the Nasdaq ?


Nasdaq 1660

what is going to happen

2 year weekly chart ?

tht upper declining red line (resistance) is irrelevant now. as it was tested 3 times already. x800 region can come . a doji candle on 2 hours time frame should give the top . n wait to short 2 more candles later n tgt should be x425. x-9 or 8. i forgot tht digit.

i dont track nasdaq as its not 24 hours rnning market. i saw ur chart n gave my view. a medium term traders should look to add 1 short here n 2nd one at 800 with sl x000 . tgt is 400 pips profit. (inverted ryt shoulder have to form by tht drop.)
 
WS: you going to keep your long over weekend, if it doesnt come under green before close of play today (ie, 9PM UK time?)
 
I recovered their 40 quid per month just today. I will now track their performance for 20 days to see winners/loser percentages. Will let you folks know about it.
 
Status
Not open for further replies.
Top