Wallstreet1928 Analysis & live calls on FTSE,DAX,S&P...aimed to help New traders

Status
Not open for further replies.
My thoughts than asked me, if we look at longer time frames to filter out noise to guage direction, why, when markets appear very tight or sleepy, why not reduce the time frame and trade a tight range taking small profits?

I've thought this on more than a few occasions myself. Given that I normally only look at EOD myself, on days when I couldn't find anything I wanted to trade, I too have enjoyed some modest successes on the shorter timeframes.

The danger, in my view, lies in slipping into trading "for the sake of it", which is why I haven't done too much of this kind of thing lately.

I understand your point regarding the danger.

I think scalping has its place but care always needs to be taken so we are not blinded to trading one way in every market situation.

Nice to hear from you btw!

:)
 
Hi Sir.. Everything is allrght.. We say that after the madness is the glory! Nice to see you again..

How are you doing?

I am fine thank you Mr Vinicius, all the better after speaking to you

Still going strong Mr Vinicius, I like the short you played to gap fill @ 4650.........I was on the same train!!

I have a day off work tomorrow so I will try and post and join you
 
I am fine thank you Mr Vinicius, all the better after speaking to you

Still going strong Mr Vinicius, I like the short you played to gap fill @ 4650.........I was on the same train!!

I have a day off work tomorrow so I will try and post and join you

WS,

The news candle kept me out until confirmation, was there something else that made you trade pre news?
 
Nasdaq still below death zone (black dotted line)

still looking bearish

unable to get past critical resistance line

key level 1588 , coincides with 38.2 % retracement from the high


> 1588 I will go long to death line and above @ 1602

< 1588 ...I will short to 1566 gap fill and previous low of 1562

HP released news after hours....its yet to be seen if its sell on news strategy, but post data reaction indicates it will be

"HPQ Reports Earnings That Beat Estimates...Stock Trades Flat After Hours
By InTheMoneyStocks.com on August 18th, 2009 4:31pm Eastern Time
This shows that the stock had runup prior to earnings and had factored in the beat on earnings and revenue. After hours S&P futures action slightly higher."

1 month 1 hr chart
 

Attachments

  • US Tech 100 Daily Future (Se (18-AUG-09).png
    US Tech 100 Daily Future (Se (18-AUG-09).png
    20.7 KB · Views: 109
WS,

The news candle kept me out until confirmation, was there something else that made you trade pre news?

reason for short @ that level prior to news release

1. S1 @ 4694

2. psychological 4700 level .........we were trading sideways for ages and the upward move looked exhausted

3. 200 MA on 10 min @ 4713 ....

4. market leading stocks giving sell signal

5. currencies looked weak

6. several key trend lines on 10 min and 60 min indicate short

just to mention a few variables .........main one being 4680 key level!

i agree with most of this but oftern find the news can turn all this on its head, we all have different entrys, there was still legs in the move to the gap after it confirmed.
Nice trade well done for getting in earlier.
 
Chart Analysis + The Manipulation Factor


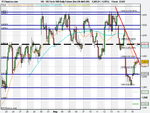
As the dollar headed south over the last 6 months, many wondered if it was about to collapse. Hedge funds, mutual fund managers, individual traders and investors had and are still short the dollar. The rally since March has coincided directly with the fall in the dollar. The yearly highs on the dollar were made in the first week of March and sure enough, the low of 666 on the S&P was also hit in the first week of March. Clearly, the rally has been a re inflation rally but there are other factors at work. The Federal Reserve has been a direct culprit of weakening the dollar. Believe it or not the dollar's drop was an obvious method of the Federal Reserve and possibly the PPT (Plunge Protection Team) to stop the markets from collapsing.


While technical analysis provides us with almost every major and minor move of the markets, oil, gold and the US Dollar, common analysis of motives of the Federal Reserve must also be analyzed. This adds a new dimension to confirm and solidify the technicals. We all know the Federal Reserve has been printing money, trillions in fact. Money to buy bonds, bailout banks, stimulus packages and more. However, it goes even deeper. Ever since the run up in the markets dating back to 2006 to 2007, oil stocks and other commodities have been added to the S&P 500. The weighting has increased more and more. This has made it so the market's overall are tied extremely tightly to the price of oil and other commodities. Therefore, the price of commodities is directly related to the levels of the S&P and other indexes. To manipulate the price of commodities higher would have a direct bailout effect on the markets. When oil is higher, the markets are higher.


Knowing this, it is no wonder that when the dollar topped out in March, the markets also bottomed. The Federal Reserve has a direct impact on the dollar. They are the printers or the money tree of the markets and the United States. This, alongside the bailouts and stimulus packages (which are both dilutive and cause the markets to drop) were bullets in their gun to help the markets regain their strength.


The problem is, it is a double edged sword. While causing the dollar to fall in the near term has helped the markets regain their mojo, it can have very detrimental effects. Our country is financed by other countries as they buy our debt. This is seen in the form of bond auctions where the interest paid is on the rise. If the dollar is losing value rapidly, other countries do not want to buy our debt. This is mainly due to the fact that in 10 years, 20 years or 30 years, these countries expect the dollar to be valued much lower based on the current drop priced out over those longer time periods. The only way they will buy the debt is if a higher interest rate is paid making up for the dollar's drop plus a profit. So, while a dropping dollar is great for the markets in the near term, if the money flow is turned off, we could spiral into a new liquidity problem even worse than what we saw in late 2008 and early 2009.


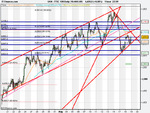
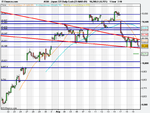
Now looking closely at the dollar recently, InTheMoneyStocks Chief Market Strategists saw a major technical support level on the dollar. On the UUP (dollar ETF) it was at $23.00-$23.05. This happened to be a major pivot from 2008. Closer calculations revealed it was a monstrous support level and cycle level as well. While this was a dead on indicator that the dollar was about to bounce, the Manipulation Factor confirmed it. What was this manipulation factor? As the dollar approached the major 2008 support level, Chief Market Strategists also realized that in the coming days there was a 3 year, 10 year and 30 year auction. There was no way the Federal Reserve was going to let the dollar continue to collapse into this auction. Why not? Because foreign countries, our debt buyers would be less inclined to bid on it in a free fall. In other words, push the dollar higher into the auctions to increase the likelihood of buyers willing to purchase the bonds for a lower interest rate.


Sure enough the dollar rallied on the InTheMoneyStocks call. This new factor, the Manipulation Factor must be used in conjunction with technical analysis. It is a great confirming indicator and can truly help one make profits. Look at the bigger picture; it was clear as a bell in this case.


Learn the game. Nothing is as it seems but a well educated investor can be aware and avoid the traps even profiting from the Manipulation Indicator.


By Gareth Soloway,
Chief Market Strategist
InTheMoneyStocks.com
The Leader In Market Technical Guidance
 
FTSE .............


key level 4680 once again ........382% retrace from previous high and gap fill


strategy for tuesday

> 4700 I will go long once confirmed ....target 4740 ..
bull flag scenario forming

< 4665 ...bull flag negated ..........short to 4620
 

Attachments

  • FTSE 100 Daily (18-AUG-09).png
    FTSE 100 Daily (18-AUG-09).png
    27.3 KB · Views: 108
Nasdaq still below death zone (black dotted line)

still looking bearish

unable to get past critical resistance line

key level 1588 , coincides with 38.2 % retracement from the high


> 1588 I will go long to death line and above @ 1602

< 1588 ...I will short to 1566 gap fill and previous low of 1562

HP released news after hours....its yet to be seen if its sell on news strategy, but post data reaction indicates it will be

"HPQ Reports Earnings That Beat Estimates...Stock Trades Flat After Hours
By InTheMoneyStocks.com on August 18th, 2009 4:31pm Eastern Time
This shows that the stock had runup prior to earnings and had factored in the beat on earnings and revenue. After hours S&P futures action slightly higher."

1 month 1 hr chart

good morning chaps ..........


OK my short was triggered @ 1582....stop loss 1592

target 1568 -1562
 
overnight markets
Asia/Pacific Last Trade Change Related Information
^AORD All Ordinaries (Australia) 4,392.20 6:48am 6.30 (+0.14%) Chart, Components, more...
^BSESN BSE 30 (India) 14,835.86 6:58am -199.40 (-1.33%) Chart, more...
^HSI Hang Seng (Hong Kong) 20,322.89 6:53am 16.62 (+0.08%) Chart, Components, more...
^JKSE Jakarta Composite (Indonesia) 2,340.97 5:59am 3.98 (+0.17%) Chart, Components, more...
^KLSE KLSE Composite (Malaysia) 1,164.41 18 Aug -4.64 (-0.40%) Chart, Components, more...
^NZ50 NZSE 50 (New Zealand) 3,081.05 6:31am 9.46 (+0.31%) Chart, Components, more...
^N225 Nikkei 225 (Japan) 10,215.86 6:48am -69.10 (-0.67%) Chart, more...
^NSEI S&P CNX NIFTY (India) 4,405.95 7:08am -52.95 (-1.19%) Chart, more...
^KS11 Seoul Composite (South Korea) 1,549.68 6:48am -0.56 (-0.04%) Chart, Components, more...
000001.SS Shanghai Composite (China) 2,799.47 6:53am -111.41 (-3.83%) Chart, Components, more...
^STI Strait Times (Singapore) 2,561.19 6:53am -6.53 (-0.25%) Chart, Components, more...
 
variable to consider

1. asian session blasted overnight once again...consistent theme emerging

2. currencies - euro and gbp weak...........euro linked to asian indices so forced down, gbp pressured by Mr Camerons remarks about debt

3. Nasdaq market leader down .....therefore world markets must come down
 
Last edited:
Morning all,
FTSE sell order if we break yesterdays low, target 4585
SP500 the same , target 966.3
GOLD the same , target 927.5
 
anyone up early enough to catch £Y. Nice breakout around 6:15, currently 100 points move.
 
FTSE .............


key level 4680 once again ........382% retrace from previous high and gap fill


strategy for tuesday

> 4700 I will go long once confirmed ....target 4740 ..
bull flag scenario forming

< 4665 ...bull flag negated ..........short to 4620

amend position to break even
 
Intraday Market Thought
from Ashraf Laidi

2009.08.19 02:50: With the Shanghai Composite Index down 3%, nearing the definition of bear market territory (almost -20% off its peak) and British Tory leader David Cameron reiterating those fears (warnings) about the loss of the Kingdoms AAA debt rating, Sterling joins the risk currencies in selling vs. USD and JPY. Cable never regained the $1.66 trend retracement show in our latest IMT, and is now eyeing interim support at $1.6380. NZD, CAD and AUD each lose ground, while EURUSD looks to retest 1.4040s as the London session opening salvo is set to produce a fresh wave of USD and JPY buying. USDCAD is up nearly a full cent from its 1.10 low, with retreating oil prices and falling equities weighing down on CAD. The 11 am GMT CPI data from Canada will also be scrutinized.
 
Status
Not open for further replies.
Top