I thought I would post a quick example of how I use the bias change when looking for fib pullback setups, and also to show why I don’t sell the break of point 4 – see bias diagram link in my sig.
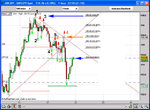
In this H1 example, we see a bias change to the downside on the breach of point 4 – numbers in black – following this, the market creates a new low (orange no. 3). The market then retraces to just over 50% of the previous swing. Given the H1 trend is down, this is a where I look to sell. If not, somewhere around the 61.8% fib.
I mark up all the new swing highs and lows as they are created. Using the alternative bias count, I start a new count – orange numbers this time. Despite the retrace, the trend is still down, as the retrace doesn’t complete a new bias count to the long side.
Because price often retraces in this fashion (though it doesn’t actually change the trend to a new direction) I prefer to wait for the retrace, rather than sell the break of point 4.
How do I know to sell the 50% level? I wait for confirmation. Confirmation is this same pattern, but on a 2m TF. So, I would look for a 12345 short bias count to be confirmed, and then look to sell the retrace.
So, as long as the trend is down, then I just look to sell pullbacks at key fib levels of previous swings, all the while I count the swings to make sure the bias hasn’t reversed. Very boring I know, but it does seem to work.
I actually look at H3 for direction and setups – but the principle is the same for any TF. Have a look at a chart, and you should notice this is a continually repeating pattern. This is not my strategy btw, this is a PN strat. There's a bit more to it than this, but best to get in contact with PN if you need further info.
Now, if I can only learn to let positions run 🙄