wallstreet1928
Legendary member
- Messages
- 6,609
- Likes
- 89
Cheers ws.
Do you also look at fib?
yes now and again .............but don't pay too much attention
price action tell you everything
Cheers ws.
Do you also look at fib?
Hey Geo, dont know if you still online, but yes I was still on that swissy trade, was a shock to come back to that massive move, Im not grumbling though😱
I now count an H1 bias change to the downside on the FTSE, on 24h data. 61.8 retrace would be 4610 ish... I'll be looking there for potential shorts tommorow i think. But, hey, perhaps this monster rally is never gonna turn, but we'll all keep on shorting regardless 😆
edit: 61.8% of previous swing is 4610, on 24h.
Oh and geo trend lines! Are these just points that connect at angles? Any suggested reading? I know you are a big fan.
u about geo?
i'm thinking reversal @ 195 (H1 [21]) on E$...what do you think?
I am long Nasdaq 1590 .......... stop loss 1570
target 1630
Yes I would be tempted to short it @ 1.42 as well provided oil hits 67.75 -90 area
u about geo?
i'm thinking reversal @ 195 (H1 [21]) on E$...what do you think?
trailing stop hit .....
10 points profit
Yes, 195 might be nice, but personaly I would prefer 1.4220 as a minimum, as in 50% fib retrace. It's looking very weak now though!! Also, I notice it's respecting the base of the channel that Mas showed us last night.
Where are you counting 21 from DB?
Did you use IG for that trade ws as i didnt think CMC offered a trailing stop facility?
Or did you manage it manually?
ATB 🙂
I do everything manually my friend
always lock in your profits ..........especially in scenarios like today!!
If Nasdaq beaks 1600, then it must fly higher as its the 4th time it has approached 1600 ....
if it fails to carry on trading above 1600 then that means Nasdaq will not continuehigher and therefore take at least 10 points profit to rewards yourself for good analysis and trade
Thanks ws.
Following your Nas100 trade and our discussion of geo trend lines, and the ITMS stuff i have started loading charts with no indicators except the moving averages etc.
I was tracking the dow as i believe this moves most when the buy programs kick in. I had a lovely geo trend line in which if i had trusted would have given me a nice bounce and a nice 50pnts play from 9048 to 9100!
I didnt have the confidence however and I didnt get a second chance to enter. Everything started dropping so quickly I wondered what was happening.
Anyway, think i will look at this tomorrow. Sometimes several indicators can confuse or delay entry as you try and pick the perfect moment with everything aligned!
Also the charts are not as clear with the indicators taking up space.
Well done to you, again sir!
Have a nice evening!
🙂
I am now short FTSE 4567 ....stop loss 4597
leave this trade for tomorrow
I am now short FTSE 4567 ....stop loss 4597
leave this trade for tomorrow
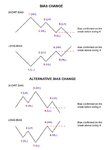
Bias change diagram. I hope PN doesn't mind me sharing this. I don't think it is exclusively his idea, so should be ok.
Ok, if you count the highs and lows on E$, as per diagram, you'll see the bias is still long. we need to make a new swing high (5), and then break through todays low to get a bias change to the short side.
DB, 14195/14220/14238 could be ideal areas to short. Of course, it might not get there!
edit: I am counting Highs and lows on H3 btw! H1 is already confirmed as short bias. Or is it? I will check.