You are using an out of date browser. It may not display this or other websites correctly.
You should upgrade or use an alternative browser.
You should upgrade or use an alternative browser.
Wallstreet1928 Analysis & live calls on FTSE,DAX,S&P...aimed to help New traders
- Thread starter wallstreet1928
- Start date
- Watchers 252
- Status
- Not open for further replies.
The 4220 is my key level...long again @ 4225, s/l 4210
I'd like to see us getting past 4240 and back up to '50
Out @ b/e.....again
EUR/USD broke through the up channel its been in for weeks on the hourly chart. I wonder if thats gonna break down further now.
See the daily tl from 21/28 April?
See that as quite a key TL for its long term uptrend, and 14000 key level on the hourly
I think a long from a move past 030 is worth it with a stop below 14000
Morning Fella's, at last ive a chance to sit down and monitor the charts, been running around like a blue ars.. fly last couple of days.
Bagged a few pips this morning with a short from the top of the hourly channel on cable.
Made up for the ones I lost on Eur/Gbp yesterday, cant believe I left a trade open, thro NFP while I was out.
Bagged a few pips this morning with a short from the top of the hourly channel on cable.
Made up for the ones I lost on Eur/Gbp yesterday, cant believe I left a trade open, thro NFP while I was out.
SuddenDeath
Legendary member
- Messages
- 14,063
- Likes
- 143
the 4180 put is 1.5times the size of 4226 long....
.....sadly, looks like today will be narrow range, currently 15pts. perhaps UK retails sale coming out as I type may move things.
@ SD, how are you hedged @ 4180, could you explain?
.....sadly, looks like today will be narrow range, currently 15pts. perhaps UK retails sale coming out as I type may move things.
See the daily tl from 21/28 April?
See that as quite a key TL for its long term uptrend, and 14000 key level on the hourly
I think a long from a move past 030 is worth it with a stop below 14000
ahhh I didnt look at the daily, yes I agree that is a good palce to go long.
Out @ b/e.....again
Im staying out until I see it touch 4215 or I may short if it gets up into 4255 area
Morning Fella's, at last ive a chance to sit down and monitor the charts, been running around like a blue ars.. fly last couple of days.
Bagged a few pips this morning with a short from the top of the hourly channel on cable.
Made up for the ones I lost on Eur/Gbp yesterday, cant believe I left a trade open, thro NFP while I was out.
Nice one Minch 👍
have you got a chart on cable you can post?
ahhh I didnt look at the daily, yes I agree that is a good palce to go long.
My most successful trades on Forex are at the limits of daily channels in the direction of the trend, especially when coinciding with a r/s horizontal price level, when that part of the channel has been established by three or more points/touches.
My most successful trades on Forex are at the limits of daily channels in the direction of the trend, especially when coinciding with a r/s horizontal price level, when that part of the channel has been established by three or more points/touches.
The Eur/Usd is a great channel in that respect, what kind of stops do you use Lapa? I guess it will have to be sizeable with it being a currency?
Nice one Minch 👍
have you got a chart on cable you can post?
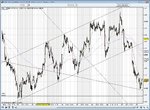
There you go bw, As you can see the top of the channel is at the 1.6425 level, which also has confluence with the neckline of the H@S on the hourly chart.
Price retested that neckline from below twice yesterday and failed to break res, support was found at the base around the 1.6335 level.
I was watching price rising up this morning to once again test the top of the channel, when it failed again, I took the short on the break of the 1.6400, as confirmation of a likely repeat of a move back down to the bottom of the channel again.
Attachments
Wish I had shorted the DAX yesterday when it broke out of my channel. and look where it stopped this morning within fractions of the low from 23rd June.
That is textbook!
I haven't properly sorted out my DAX charts, thats something for this w/e
Ref currencies: yes the stops are wide, but my position size is much smaller. Its the r/r that is so attractive though - a move can trend heavily in your favour if you get it right, and the currencies stick to their high level TF channels very well.
Also what I do is when I find a consolidation on GBPEUR in the morning that has lasted more 2hrs, I trade in the direction of a break from that range (range being high and low over the last 2hr range). A break means a full 5M closing over - this is separate to my normal trading and on a low TF.
For example, see yesterday - a full 4 hours of a tight range between 11658 and 11675. The strong move @ 0655 outside and the 5Mbar closed - s/l to the major s/r level (there usually is one when this consolidation period happens, price tends to stick to a major level overnight in this case 11660, but could place s/l back to the top of that consolidation range)
Works very well, obviously not all the time, but not when price has been trending before - only after consolidation. On a higher TF, like 2HR, you can see these overnight 'pauses' most clearly. When I get the move in my favour I put stop to b/e immediately, and sometimes may reenter if stopped out on a pullback.
Sorry thats off the point, just rambling cos I'm having a look at it now 🙂
There you go bw, As you can see the top of the channel is at the 1.6425 level, which also has confluence with the neckline of the H@S on the hourly chart.
Price retested that neckline from below twice yesterday and failed to break res, support was found at the base around the 1.6335 level.
I was watching price rising up this morning to once again test the top of the channel, when it failed again, I took the short on the break of the 1.6400, as confirmation of a likely repeat of a move back down to the bottom of the channel again.
Those channel trades are what I love on forex, nice work.
If you failed, you lose small compared to the gain on the room on the other side in the channel.
Fancy it again? Price approaching that bottom level now... 🙂
EDIT: not a nice range on lower TF between 16370 and 16340, looks congested - but hey its 4July, what am i thinking?
There you go bw, As you can see the top of the channel is at the 1.6425 level, which also has confluence with the neckline of the H@S on the hourly chart.
Price retested that neckline from below twice yesterday and failed to break res, support was found at the base around the 1.6335 level.
I was watching price rising up this morning to once again test the top of the channel, when it failed again, I took the short on the break of the 1.6400, as confirmation of a likely repeat of a move back down to the bottom of the channel again.
oh yeah 😱
Thanks very much Minch, Im gonna sit and analyse that chart now. Cheers mate 👍
Those channel trades are what I love on forex, nice work.
If you failed, you lose small compared to the gain on the room on the other side in the channel.
Fancy it again? Price approaching that bottom level now... 🙂
EDIT: not a nice range on lower TF between 16370 and 16340, looks congested - but hey its 4July, what am i thinking?
Im tempted lapalabra, but is it going to break and head south to the bottom of the daily channel at 1.6217. mmmm
That is textbook!
I haven't properly sorted out my DAX charts, thats something for this w/e
Ref currencies: yes the stops are wide, but my position size is much smaller. Its the r/r that is so attractive though - a move can trend heavily in your favour if you get it right, and the currencies stick to their high level TF channels very well.
Also what I do is when I find a consolidation on GBPEUR in the morning that has lasted more 2hrs, I trade in the direction of a break from that range (range being high and low over the last 2hr range). A break means a full 5M closing over - this is separate to my normal trading and on a low TF.
For example, see yesterday - a full 4 hours of a tight range between 11658 and 11675. The strong move @ 0655 outside and the 5Mbar closed - s/l to the major s/r level (there usually is one when this consolidation period happens, price tends to stick to a major level overnight in this case 11660, but could place s/l back to the top of that consolidation range)
Works very well, obviously not all the time, but not when price has been trending before - only after consolidation. On a higher TF, like 2HR, you can see these overnight 'pauses' most clearly. When I get the move in my favour I put stop to b/e immediately, and sometimes may reenter if stopped out on a pullback.
Sorry thats off the point, just rambling cos I'm having a look at it now 🙂
hey you a re not rambling, thats really intersting and very decent of you to share your analysis. Many thanks Lapa.
Just to take that analysis and look at todays action with last nights data. Am I right in thinking there is a similar consolidation period between 5.15pm yesterday and 8.15am today? the levels in that range appear to be a low of 11700 and a high of 11721 (peaked twice at 11730 witha big spike at 10.25pm) and then it as zonked down to a low of 11666 so far today?
Im tempted lapalabra, but is it going to break and head south to the bottom of the daily channel at 1.6217. mmmm
I'm watching closely, there's something here?
Break below 16320 opens up 16250
The daily channel beneath around 16230 and the 16190 support are close enough together to make this a really good long if price reaches it. This would be ideal.
What do you think?
I'm watching closely, there's something here?
Break below 16320 opens up 16250
The daily channel beneath around 16230 and the 16190 support are close enough together to make this a really good long if price reaches it. This would be ideal.
What do you think?
Agree, I might play a retest from below of the break of 1.6320.
- Status
- Not open for further replies.
Similar threads
- Replies
- 72
- Views
- 21K
- Replies
- 21
- Views
- 8K