Vix

Riz

Experienced member
Messages
1,266
Likes
6
Best keep an eye on VIX and take this sharp fall seriously, no sign of bouncing back up on the chart apart from RSI heading for oversold levels...I wouldnt therefore expect Dow to fall before VIX stops falling and start rebouncing...Looks like we're on our way up for the time being, it doesnt of course mean the bear market is over and not even neccessarily we've seen the bottom...we may well backtest the bottom or even break it down, but for now we still going up...

Riz
 

Attachments

  • vix.png
    vix.png
    18.4 KB · Views: 1,442
Well it did go up impressively, only maybe too agressively...over 1k from lows in a week time, looks too much for this beast...vix fell from over 56 to 33.73 gapping down and forming a doji with rsi o/s...looks like the beast needs to take a breath...vix may bounce here or at least stop falling...updating the chart

Riz
 

Attachments

  • vix.png
    vix.png
    32 KB · Views: 1,343
Nicely bottomed and bounced off it, RSI on a strong uptrend, looks like it will go further up before retracing, thus putting the dow in trouble, expecting VIX further up and DOW down...

Riz
 

Attachments

  • vix.png
    vix.png
    28.7 KB · Views: 1,307
Hi Riz

Would the opposite have been true about VIX in the Bull market. i.e. If the VIX goes up then so should the indicies?
 
Hi FB,

Your question made me think that I should have added some info on VIX for those unfamiliar with it...so doing that now, in a way to answer your question too..

VIX (The Market Volatility Index) measures the volatility of the market "taking the weighted average of the implied volatility of Standard & Poors 100 Index calls and puts."

It is therefore used as a general indicator of market volatility and sentiment rather than volatility of a certain stock or index...

It is an inverse indicator like TRIN, higher levels indicate bearish sentiment while lower ones indiating bullish sentiment...

On this basis in a bull market we'd expect VIX going down while indices going up...and vice versa in a bear market of course..

Finally "The further VIX increases in value, the more panic there is in the market. The further VIX decreases in value, the more complacency there is in the market. "

Hope this helps and you were on the short side today..

Riz
 
The call on the basis of VIX turned out to be right, DOW kept going down while VIX going up all the way to 48.97...only in last 1/2 hour VIX fell substantially to 45.39...

This suggesting to me DOW is likely to try up first on monday, the 5 min dow chart also showing it ending the day strongly pushing above 8300 level which served as strong sup/res level last 4 hours of the session..RSI (5 min) also seems to be pushing sharply well over 50 line...

Over all the last 1/2 hour fall in VIX, 5 min DOW chart pattern and RSI suggesting DOW should try up first on monday, 8300 level will be significant at the beginning of the session and it needs to hold to prove an initial rise...having said that I am not convinced of a susequent rally and think further falls could be more likely...

Riz
 

Attachments

  • vix.png
    vix.png
    16.5 KB · Views: 1,212
Adding the dow 5 min chart...

Riz
 

Attachments

  • dow 5 min.png
    dow 5 min.png
    20.1 KB · Views: 1,173
Well before the follow up on VIX I'll first add a dow 30 min chart here to see what happened after the previous dow 5 min chart...

As seen on the chart dow did manage (after a bit of struggle) to turn 8300 into support and just carrie don up from there finally ending up well above the critical level of 8700...

Riz
 

Attachments

  • dow 30 min.png
    dow 30 min.png
    47.3 KB · Views: 1,126
Now going back to VIX...using the daily chart this time, we can see a down channel formed after it formed a lower high, interestingly stochastics and RSI also formed a lower high and trended down from there, the weakness on the chart is therefore supported by the weakness on the indicators...

The uptrend line is not broken yet, but it looks like it could atl east be backtested...

Thats probably where we can have further proof of the seriousness of this VIX down move and have an idea how far it may go, in other words how strong the recent upmoves on the indices are...

There are some +ve patterns on the indices charts as well which I think should be pointed at...I will therfore carry on with s&p, dow and ftse charts in an attempt to see the correlation between the VIX and indices...but first VIX chart

Riz

Riz has attached
 

Attachments

  • vix.png
    vix.png
    21.1 KB · Views: 1,105
Firts ftse daily chart...two significant developments on the chart, down trend line broken and forming an ascending triangle...

Break of down trend line on its own is very significant unless its a false one and it falls right back below it, but forming an ascending triangle which is a bullish formation indicating accumulation should make us take it seriously...

Additionally the 2 indicators used on the charts RSI and stochastics are both on a sharp uptrend after double bottoming...

Over all quite a bullish picture....

Riz
 

Attachments

  • ftse daily.png
    ftse daily.png
    22.2 KB · Views: 1,000
Now SPX, we got similar patterns as on the ftse chart, down trend line almost broken (this need further continuation), forming an ascending triangle, both RSI and stochastics on a sharp uptrend

Riz
 

Attachments

  • spx daily.png
    spx daily.png
    23.7 KB · Views: 970
Finally dow daily chart showing a similar pattern, down trend line almost broken (this need further continuation), forming an ascending triangle, both RSI and stochastics on a sharp uptrend...

Riz
 

Attachments

  • dow daily.png
    dow daily.png
    37.5 KB · Views: 1,013
Now the question is where all this going to take us...bullish patterns on significant indices charts, weakness on the VIX...down trend lines been pierced, are they going to go straight up from here or pull back and retest it and if the lines are retested, will they hold as support?

I have a feeling a sharp bear market rally could be boiling up, the only thing thats missing here is the volumes, unfortunately my charts somehow didnt bring out volumes while doing this work, but I do now that recent rises are not on higher volumes and therefore can safely suggest that in order to keep going up we need higher volumes next week...

Over all its an interesting level and needs to be watched carefully next week...

Riz
 
Just updating the VIX chart, notice yesterday though the market tanked VIX didnt go up, a signal that the fall less likely to sustain...vix -3.44 today and now piercing down the uptrend line therefore I'm still with the comments made in the earlier post...

Riz
 

Attachments

  • vix.png
    vix.png
    19.9 KB · Views: 947
More or less moved as called previously, only bad data spoiled it...still VIX kept falling and indices closed +ve a bit off hods though....

VIX fall looking quite significant, falling below the downchannel as well as the uptrend line breaking horizontal support at 35, next support level 30..RSI and stochastics still tumbling down...

Tomorrow looking +ve for the markets..


Riz
 

Attachments

  • vix.png
    vix.png
    20.2 KB · Views: 834
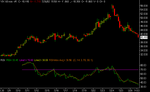
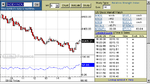
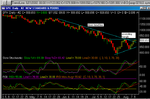
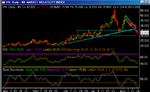
Just updating the chart really, nothing much changed, VIX ended the day only slightly lower -0.25 at 32.82 while indices closing mixed; dow -ve but well off lows indeed half way between hod and lod, nasdaq well +ve though...

So overall a whipsawing and boring day with little intraday TA to guide and double witching adding more to the whipsaw plus being friday putting investors off taking positon over the w/e...

Considering the bad data, fed comments, bankruptcy and war news, market held very well this week unlike a few weeks ago when not only bad news even not enough good news would start a tank...

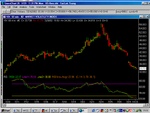
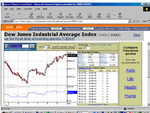
Market still resisting the downside pressure and signalling it wants to go up first, dow consolidation at highs plus todays vix intraday consolidation at lows suggesting we're getting closer and closer to a break of at least 400 points, the question is which way...my reading is up, this market saying it wants to try up first, thats of course barring extreme bad news...still its a bear market and they tend to have crazy moves, one can never be sure..

In the mean time I'd better add that in spite of trying to read the market on this thread, I still dont take medium or long term position and trade only intraday...I dont trade in anticipation of market direction but only the moves I see occurring...therefore my comments here should be treated as exercise of thoughts and nothing to do with trading or investing advice...

Riz
 

Attachments

  • vix.png
    vix.png
    19.8 KB · Views: 775
And it occurred, we had a major rally day all European and US indices joined it: Ibex +256, ftse +96, dax +152, dow +212, compx +33, spx +21

All the ascending triangles mentioned in earlier posts (ftse, dow,spx) clearly broken to the upside...

As for VIX it carried on with its fall -1.25...

The question now is whether we've rallied enough and if not how further up we may go...

Major indices now showing signs of being overbought while VIX looking oversold...but of course that doesnt mean they cant go more o/b...

It looks like 9k is going to be the major level to watch for the dow and 30 for the VIX...my impression having considered the recent moves as well as sentiment and momentum this market can still go further up meaning a few more hundred points for the DOW, but as I said it looks o/b now and a retracement may come first though the sentiment still saying up...

Updating the major charts I used in earlier posts to show the overall bullish sentiment and to follow up...

Riz
 

Attachments

  • vix.png
    vix.png
    18.5 KB · Views: 725
Top