Vix

VIX closed up +1.23 at 40.54 while dow up +67 at 8380...

No major changes at both daily charts, but the 15 min charts worth to dwell on...

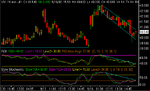
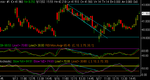
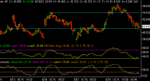
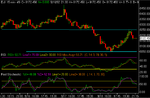
VIX although opened gapped up, it soon started trending down forming a downchannel in which it moved till the end of the session finally closing the up gap...at the same time both indicators also trended down and both downtrend lines are still intact...thus suggesting further VIX down moves tomorrow...

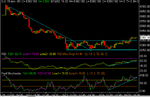
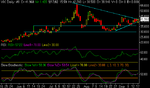
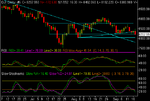
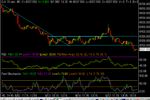
In the mean time dow first tested the bottom of the rectengular consolidation mentioned in the previous post and kept trending up from there finally breaking the consolidation on the upside and settling well above it...both indicators formed clear uptrend lines and moved inline with it...now that this consolidtion has broken up and dow proved it got its near term bottom we can expect it trending up to retest the lower high it formed last week at 8600 on the daily chart, failure to break this may well start resuming the downtrend while a break may pave the way for the dow to retest the 8720 highs on the 15 min chart also formed last week...only after settling above these levels we can talk about further up levels and the break of the overall downtrend, failing to break any of these levels will however prove this as another bounce in the overall downtrend...

Riz
 

Attachments

  • vix15min.png
    vix15min.png
    16.7 KB · Views: 399
Tricky call here. Looking at VIX, one could be fogiven for thinking there may be either a "W" forming, or even a cup and handle.....Either way that spells DOWN, contrary to to what I think the dow will do. I see DOW is up big time overnight....
 
A very bumpy day indeed...VIX closed up +1.42 at 41.96, DOW down -172 at 8207...

In fact they did initially moved as expected in the previous post, VIX opened gapped down and kept going down even breaking our 39 support line drawn on the 15min chart to 38.5 about 4 points drop for vix suggests a rally for indices, they were rallying at the same time...dow futs hit 8600 lower high pointed at in the earlier post...

But all that didnt take long, bad news/data just didnt stop and market sentiment and direction soon reversed...

VIX trended up back in the down channel on 15 min chart, broke it on the upside settling above to go sideways only to have another big bounce right before closing at hod....

VIX daily broke the symmetrical triangle mentioned in earlier posts twice, first down then up though only just to close at the upper line of the triangle forming an engulfing upcandle...thus suggesting a possible strong break on the upside on the cards...

Next resistance levels seem to be 43 and 45 support at 40.5, 39 and 36...indicators, the strength of the upmove and the engulfing upcandle on the daily chart suggesting VIX may test resistance levels first...

DOW broke the rectangular 250-350 consolidation on 15 min chart first on the upside then retraced and trended in it again till strongly breaking it on the downside near close...on the daily chart we now see a h&s broken down the neckline, a big red candle with a big wick on the top, tumbling down indicators...so nothing suggesting an upmove, all pointing down...apart from 00 and 000 numbers being psychological support levels, we have 8046 as horizontal support and if they all fail backtesting our major downtrend line is on the cards which is suggesting 7800 as as the closest round number...

So we're back on our overall downtrend, apart from occassional bounces on the way down to backtest broken support levels or trendlines, we go down unless new developments reverse sentiment causing to break major resistance levels on the upside...cant think of any for tomorrow though...reconsidering a new uptrend only possible if dow manages to bring itelf back above 8300...

Riz
 

Attachments

  • vixdaily.png
    vixdaily.png
    15.7 KB · Views: 370
Not much surprise today, more or less as expected apart from midday reversal, without that it would be too boring really...

VIX opened gapped up and consolidated around our first resistance level of 43, soon broke it on the upside and headed for our 2nd resistance of 45, but failed to break it and started reversing at 44.30...having turned 43 resistance into support tried to bounce off it, only failed to make the highs and soon retraced to break down 43 and trend down the rest of the day to close at 40.89 down -1.07...

DOW on the other hand opened gapped down and trended down till midday when it reached 8051 as lod, not far from our figure of 8046 mentioned in the earlier post...from there it kept trending all the way up to 8253 to hit the bottom of rectangular consolidation mentiond in earlier posts, just as the picture started looking a bit bright; dow trending up, vix trending down, all indices +ve, a sell off started in last 20 min to push dow down to 8172 for a loss of -35...careful observers would of course have noticed that trin kept resisting to go +ve and stayed above 1 all day, vix didnt have much time to catch up and reverse to +ve though....

It would still be taken optimistically due to the strength of midday reversal, had the sell off not carried on after hours to push dow futs well under 8100...

So what now? VIX will obviously try to close the divergence and highly likely start the day up unless we see major reversals in index futures for which I dont see any reason ...both indicators also pointing to a turn here...

On the 15 min chart we see horizontal support for VIX at 40.50, our major resistance levels of 43 and 45 are still intact...

As for the dow we now got 8050 support strengthened, so need to be watched on the downside, 8k and 7800 further major levels to watch...upside resistance is still the bottom of rectangular consolidation at 8250, breaking and settling above 8300 will obviously suggest strength and further possible upmoves...

So our major downtrend still intact, but todays moves proved once again that DOW still capable of big bounces even when sharply down trending...and we now got a larger range providing more space for such moves...got to be watched carefully...

One last point, now we see everyone and his dog talking about and expecting big falls, even a major crash...as far as I know they dont crash like this, they do it when least expected not most expected, therefore although my TA reading is that we're in a major downtrend, I wouldnt be surprised to see big bounces off the given support levels and suggest we keep watching it with an open mind...especially at a time when trading is so hard, some say the hardest since 1929 crash...

Riz
 

Attachments

  • vix15min.png
    vix15min.png
    16.7 KB · Views: 363
Due to a break and being busy afterwards, I havent updated vix thread for a long time...now that things getting quite hot maybe its time vix thread updated...first a look back to see what happened and trace the signals VIX has given us so far towards the big rally started in October when dow hit 7200 to yesterday hod of 8880, a rise of 1680 points in a short time, more than 1300 of which in 8 trading sessions...followed by a month of consolidation when dow added over another 300 points...

We also know that many traders if not most expected a bigger market crash as of end of summer especially in October, but to their surprise market responded with a sharp rally, no doubt many of them got caught out on shorts...so we look at vix daily chart to trace the signals its given us about the current rally and try and find out if there are any as to where we may go from here..

Line 6 shows the double top formed in sept 2001 and june 2002, clearly telling us we need to see vix breaking this resistance for bigger market crashes...

We see vix trying again in august 2002 but instead of going for the earlier top it ended up forming a lower high which later in october 2002 turned into a lower double top (line 7)...at the same time if we have a look at the trend line 0 we see a clear R/S switch, another signal that vix failing to make it higher and set for big drops referring to market rises...

Trend lines 1 and 2 also failed to hold vix while res line 9 managing to push it further down...

The major horizontal support line 5 at 30 was the last one failing before the last vix falls and market rises...

This left vix just a bit above another major horizontal support line 3 at 26...following this is line 8 at 22/3 and line 4 at 20...

Considering the way the chart has developed it wouldnt surprise me to see vix hitting 20 before starting any uptrends, however 20-26 level (line 3 to line 4) is the most crowded vix level where it often forms rectengular consolidations, we may therefore first see bounces off line 3 and in between line 3 and 4... also breaking down line 4 at 20 is a hard case and will refer to even bigger rallies if it occurs...also worth to note that both rsi and stochastics are at very oversold areas though no signs of +ve divergences yet...

As for the dow daily chart the 2 things worth to note would be the steep downchannel broken up on Oct 11th signalling the reversal and the head & shoulders clearly broken on the upside on Nov 21st...giving us a target around 9k, as 9k is also a major resistance level, it would be worth to note that the test of it should give us clear signals about further rallies/falls, and best to wait and see how dow handles that level...

Both stochastics and rsi are overbought on the dow daily...

Overall the vix still weak and dow strong and apart from o/s, o/b indicators no signal of reversals yet, still the levels we're entering on both together with the o/b, o/s situations are suggesting consolidations needed at around these levels before further big moves, therefore we are more likely to see retracements as well as advances while consolidating as of next week...as for the widely talked end of year rally to take the dow back to 10k, I think we need to see how it handles 9k first and its best not to get carried away we've already gone up too much too soon anyway, but I still wouldnt discount it if the dow breaks and settles above 9k...

Riz
 

Attachments

  • vix daily.gif
    vix daily.gif
    17.7 KB · Views: 331
We had 3 sessions since last update, for the market first one up + 50 points, second one down -172 third one up +255, so although wed gain looks huge most of it is recouping previous day's loss...over all more or less in line with what is said in the previous update "therefore we are more likely to see retracements as well as advances while consolidating as of next week"...

Vix however though fell on the first session, on the second one bounced off the support line 3 and on the 3rd one while market rallying it had a big rise to break and close above line 5, thus diverging from the market...worth to note as they will eventually get in line...and that is where the question starts, was the vix bounce overdone due to being very oversold and its therefore going to fall back below line 5 which is a significant level or the other way round dow rally got too far as a reaction to the good economic data and traditionally +ve sentiment due to thanksgiving day...or a bit of this a bit of that...need to see a couple sessions to clarify this before guessing the market direction on the basis of trin...

Still we got dow daily chart to work out what may happen next...both rsi and stochastic are back at overbought levels though indicating strength (see horizontal lines at top), sooner or later a pull back is on the cards...only dow is not far from the 9k initial target and it looks like either before or after a pullback this level is going to be tested...it may even be tested more than once before breaking and settling above it or giving up and reversing the trend, the way things have developed since the start of october rally, it may well break and settle above it to prepare for a year end rally...

I have added another line (6) to the chart break of which seems to me could be a good indication of a trend reversal...

Riz
 

Attachments

  • vix daily.gif
    vix daily.gif
    15.8 KB · Views: 250
Hi Zebra,

Unlike VIX, Dax Volatility Index and Amex Volatility Index are not on my regular watch list...

Riz
 
Nothing much happened as it was half session with most traders still on holiday, dow retraced a bit, so we still at advances as well as retracements mode and will be like this till 9k is sorted...

VIX however kept going up adding another +0.24 on the day... if it does manage to consolidate above line 5, I dont see big chances of market rallies, so we wait and see which one changes direction first to get in line...

Riz
 
Top