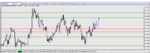
Few people have read some of my posts about my strat asked me for a example of how I set up my charts.
Here is a example for today.
I also attached the S/R levels for the US majors and a explination how we trade these levels.
Current results - trading only the confirmed breaks with no runner trades.
EURJPY broke R1. Enter on retrace to R1 and TP on R2 = +30
Break R2 enter on retrace to R2 TP R3 = + 60
Break R3 enter on rtrace to R3 TP R4 - Still running at +50
Confirmed and banked 90 pips on EJ.
EURUSD - Broke all Rs on one cande, following the rules to the letter no trades on this pair.
GBPUSD - Broke over strong zone, first Tp R1 + 20 pips.
Never retrace enough to give good R/R ratio for any other trades.
Total +20
NZDUSD - broke over strong area, first TP R1 + 20
broke R1 2nd TP R2 + 10
broke R2 SL hit - 20
Total +10
USDJPY - Broke R1, trade still running at about even
Total 0
AUDUSD - broke under strong zone, SL hit -20
broke r2 tp r3 + 20
broke r3 tp r4 - close to hitting tp for +20
Total closed 0 - +20 running.
USDCHF - broke over strong zone sl hit - 10
broke under s1 - tp + 10
broke under s3 tp hit +20
total +20
USDCAD Levels was tight together and hardly worth trading.
Came out +5 pips I think, was very erratic day on CAD.
Gross total +150
If runner trades were taken most trades would still be running with a total of over +500 pips.