UK Shares that interest

very good chart mate - thats 22 week ema right?

I also like ARM very much and think thez plenty of dippies round buying into any dips it makes.

u probably trade on larger time scales than me. See since I go for several days swings - say I long ARM now @ 121.50 I'll get out at say below 118.75 if i am wrong but if I c it is just a game to shake off smaller longs I wud re-enter back at those levels. U mentioned u take weeks' swings so obviously u get wider stop-losses

btw my L at 121.50 seems to be exactly where your EMA is - so we r pretty much on the same frequency rnt we? :)
 
Yeah sounds like we are travelling on the same lines but on different time scales. Wow, is nice to know a 'newbie' poster like myself is on the level with a veteran poster like you. Well, at least on this trade. I would be waiting for my daily indicators to be low even though your long maybe have been at 121.5, so from my plan that wouldn't be a signal coz i use different MA's on my closer time frame. As the timeframe changes the MA's curveture. But that's just nit picking. Cheers for keeping me on my toes though!
 
Last edited:
Here`s a BIO company with huge potential. I should declare an interest in BPRG before a go on any further.


Most of the tabloids and broadsheets mentioned BPRG. Dealers have been expecting the next big deal, greater than the FMC announcement. This has undoubtedly fuelled the recent heady rise what we have witness last week, which continued on Monday only to pause for breath Tuesday.....fall back actually by 10 points as investor lock in gains ahead of March results.

Rumours and speculation is rife that a deal with one of the large pharmaceutical for BPRG`s NRobe will be announced this week. Any rumour would not be complete without a bid for the company.
IMO there is not the slightest possibility of any hostile takeover until the technology is proven on continuous production in a few sites; and there are no persistent troubles running or sealing the film. No organisation is going to risk the £300m neccessary to make an acquisition until they have the technical confidence.

It is agreed that FMC and HH did their due diligence enough to accept long term high value commitments but it is certain that they were assisted in resolving all normal doubts by plenty of varied and thorough disclosure unavailable to unwanted predators.

That gives at least six months grace. That also gives the share price plenty of time to respond to the following short term events:

The contract cementing the letter of intent due any minute
A third contract hinted at by GH
the first year results due March 8
reaction to the first in depth analyst's report
orders/contracts emanating from FMC's clients
questioning at the AGM

By that time few who know the share well, will be surprised to see a price of £3 - particularly if the company can, at any one of these opportunities, announce satisfactory production operation on a real, substantial market product introduced by Farmasierra, or an FMC client, or at Peter Black now Perrigo.

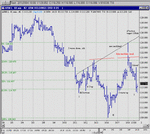
As pointed out here yesterday the resultant of the forces of greed and fear acting on the share price seems fairly constant with the share price hugging the centre trend +/- 10p, and rising an average of 6p/day . It failed to make an advance today because IMO it outran the trend, and was overbought yesterday. If demand does not deteriorate it is not inconceivable that this trend which broke out on Feb 2 could be maintained, and the £3 level achieved during the spring. That does not mean that I am forecasting that it will - just that it is not at all inconceivable. It equates to a forecast of £10m/pa profit for 2005 - on a PE of 30. For a growth rate of the kind certain to be experienced if the technology works out, that is not too fanciful a PE, and the concomittant £10m profit is well within reach for next year.
 
ARM.L - very interesting here. Big H&S duely delivered 110 pp as its target. What I am seeing now is an inverse H&S forming, with a trgt of 130 pp. Looking to buy right shoulder on a dip below 115 pp.
 
China...what charts are you looking at? I was wondering if you could show me a chart of your head and shoulders pattern and mark your targets, etc. I'm not a great believer in the head and shoulders always being an effective pattern. But that's only my experience. Personally i think alot of other factors come into play when studying charts. You seem to be a big fan of the H&S and i how well this pattern works for you? And what you actually define as a H&S?
 
T - let me explain why some H&S r better than the others and how i trade only the better ones :)

Imagine an Inv H&S. IMO if the right "collarline" is higher than the left one - this is a good one since u start getting HHs. if its the opposite - your odds of playing it r much worse.

The beauty of H&S is that u get a very natural stoploss. say u r long ARM now, a bit below 115pp. Obviously once the head is negated - u get a LL and u jump out. In this case - its 110 - well of coz u want 2 c how it moves round 110 if it gets there - it may be just big boys shaking off small longs :) - but u c my point.

ARM's right "collarline" on this Inv H&S was higher than the left one so it's reasonable odds. Plus I am long avg 114.625 - so the stop loss at 110 (4%) is quite tight imo for a tech volatility stock.
 
i still can't see a inverse head and shoulders yet on ARM, And as before i would need a chart to see what your explaning. if your looking diagonally for heads and shoulders as that's the only way i can picture one on ARM, then i'm not sure if thats a real H&S. As they occur round important price areas (if they happen!) and a diagonal would mean the heads and shoulders may be hitting different prices each time, and not true support and resistance. But if that's not what you mean, then forget the above! I tend to use support and resistance and mean reversion indications to spot value areas and times to buy. I try to keep away from trying to anticipate moves and stick to just trying to jump on board an uptrend. But it all sounds easy in theory!
 
I - last Inv H&S I played was from 119 to 135 back in february - well i did not get filled then on LSE, was long ADRs @ 6.50 USD to be precise. That one took about a week

Then a bigger-time scale H&S presented itself and u shud've bn short 135 (completion of smaller Inv H&S trgt) down to 110 - neckline of that bigger H&S. U'd sit on that trade for about 2 weeks. I did not play it fully as i was distracted by MSY :)

This new one - I'd say a week.

T - wish I cud show u my charts - sadly here in Brasil i've got only US subscription to QCharts, and on ARMHY.O the picture is not at all as clear as on the mother share.

I do sneak into my g/f's relative's office and look at Bloomies :) however I am not exactly sure if Bloomies' files can be easily uploaded here. lemme check.
 
T - do I get u right that here e.g. u r playing "measured move" so given recent slide in what is supposedly a new upchannel from 121 to 109 = 12 pp u'd expect to be buying a 1:1 measure - 123 - 12 = 111 pp?
 
ermm... timeframe being Daily chart? and Weekly chart? 60mins? 15mins? Which one! i cant see these patterns! You say bigger time scale...but then don't state what that time scale is. Hence my rantings above.
Not really into measured move at the moment. I'm not trading ARM either! I started this thread and i feel obliged to keep it going! I was out of ARM when it started looking weak, in that it wasn't making higher highs and higher lows. I don't believe that you can make calculations and make them work on any market, i go by what i can see on a chart. IMHO these techs are showing signs of 'wild capitalisation' trading hugely over price to earnings . But i swing trade and most here day trade. So this may not be important to your style.
 
This may be what China is referring to?

Worth a long on the share comp anyway!
 

Attachments

  • clipboard.gif
    clipboard.gif
    36.4 KB · Views: 379
Cheers Frugi! thanks for clearing that one up. I only use intraday for entry,if at all! So no wonder i couldn't see it! But now i have realised that were working from different systems and timescales......erm... what more can i say! I still get attracted to trading ARM because of its channel width on a daily, which makes it look good for making gains. But it is speculative and possibly over priced from a fundamental view.
 
Fru - many thx mate! exactly what I meant.

T - YES I do think ARM like any other stock (apart may be from Enron :) ) is overpriced. I do think this economy is a scam living on massive debt and it needs 1929 to start growing "normally". But I am not an economist - a trader rather :) - and if it goes up I buy! :)
 
'ARM like any other stock is overpriced' . Personally i don't think there all overpriced, otherwise i would be in my 'stand aside' trading position. And standing aside is a position! But i do think there's some good stocks to trade for my current strat. and try use low p/e's and fundamentals to give me a clearer view of what i'm trading and what other participants see whether fundamental or technical.
 
Hi CW and techst@

It's possible that china white is talking intraday here but I attach a daily chart of ARM.

There is a head and shoulders there but not IMHO a very convincing one. It is yet to deliver. No sign of an inverted H&S to my eyes.

Head and shoulders are, I believe, the pattern that most people get wrong. It is more likely to be a continuation than a reversal pattern. It needs a good strong trend before hand to make it a serious contender.

Much better to treat the head and right shoulder as a triangle (or wedge as with ARM) and then wait for the break.

BTW - ARM does complete patterns fairly regularly. e.g. ascending triangle commencing 9th Sept 2003 breaking out 01/12/2003 and completeing the target on 19/01/2004


HaHa - took me so long to write this post that it's overtaken by events!! (edit)
 

Attachments

  • arm170304.jpg
    arm170304.jpg
    96.5 KB · Views: 396
Can anyone please recommend some useful books on investing in UK stocks?
I'm a student and I'm eager to learn....
Would be very grateful
Marija
 
Marija,

At the risk of getting absolutely slated.... forget all these wiggly lines, and get your self One Up On Wall Street by Peter Lynch. It is very simple, founded in good solid sense and IMHO a good place to start.

OK, so it is American, but principles are the same here.

And call this cowardice, but I retract my remark about wiggly lines already... It was borne of ignorance. Apologies.
 
any1 here viewing RR's 230 ish range as the right shoulder on a longer scale H&S? obviously 240 ish is a very natural stop loss as it wud negate this H&S.
 
Top