Trading Weekly Levels

Chad Seven

Well-known member
Messages
280
Likes
41
I had a journal here a year or two ago trading breakouts.

It went quite well, I made a return of 15% over six months or so but there were some problems, a) I was undercapitalised and b) I would go through periods of looking at a potential setup and not be able to decide if it was an actual setup or not which would result in indecision and suggested that there was too much subjectivity involved for me to feel comfortable.

Around the time I stopped posting I found a new job, shelved the trading and put £20,000 of my trading funds (most of it) in the crypto market and it turned itself into £140,000.

The new plan is to paper trade until the end of the year using the approach a fellow named pocrel demonstrated in his thread. I once read if you are undertaking a project look for examples of people who have succeeded before and emulate them, I have a habit of setting off to do things in my own very idiosyncratic way.

If the results are good go live in 2023.
 

Attachments

  • The-Wolf-of-Wall-Street-20120925-21.jpg
    The-Wolf-of-Wall-Street-20120925-21.jpg
    41.9 KB · Views: 104
Last edited:
The approach, at a high level, involves trading reversals at weekly levels and using a trailing mechanism for taking profits.

Markets: Gold, Silver, Brent, Crude, USD/CHF, AUD/USD, USD/JPY, EUR/USD, GBP/USD, Dax, FTSE, S&P, Dow (I would like to reduce this list over time)

Approach:
1. On a weekly basis mark up previous weekly high and low on each market.
2. Entry at break of head of H1 pinbar off a weekly level.
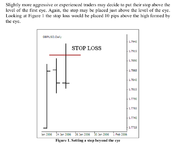
3. Stop at either other extreme of the pinbar or I shall use the "aggressive stop" detailed on attachment at my discretion.
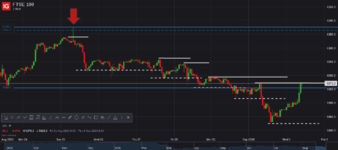
4. Trail winners by moving stop under each higher low/lower high. See FTSE example attached.

I think that is it.
 

Attachments

  • Agressive_Stop.png
    Agressive_Stop.png
    42.6 KB · Views: 125
  • FTSE 100_20200902_10.13.png
    FTSE 100_20200902_10.13.png
    55.2 KB · Views: 132
Last edited:
The approach, at a high level, involves trading reversals at weekly levels and using a trailing mechanism for taking profits.

Markets: Gold, Silver, Brent, Crude, USD/CHF, AUD/USD, USD/JPY, EUR/USD, GBP/USD, Dax, FTSE, S&P, Dow (I would like to reduce this list over time)

Approach:
1. On a weekly basis mark up previous weekly high and low on each market
2. Entry at break of head of pinbar
3. Stop at either other extreme of the pinbar or I shall use the "aggressive stop" detailed on attachment at my discretion.
4. Trail winners by moving stop under each higher low/lower high. See FTSE example attached.

I think that is it.

There is something I shall be thinking about with regards to trailing mechanism. The FTSE chart is a good example of something that happens regularly, after a period of the price moving in the desired direction there was a big sell-off, with the trader (me) feeling very happy with themselves and imagining they are in "the big trade" only for a rapid correction to take place wiping out ~50% of paper profits.

I need to come up with a way of capturing more of this final move while keeping me in the trade in case it continues.
 
Last edited:
I don't follow the news so I don't know what it is but something has spooked the markets bigly.

When the 'you know what' hits the fan I don't think people will be safe in crypto as many of its advocates are saying. BTC seems to be correlated with tech stocks and will go down with them.
 
Last edited:

Stop moved to above recent lower high.

You know, trading is all about being in the right place at the right time, it is moves like this that will make the strategy.

I am not naive enough to believe price levels have amazing predictive power and the PTB decided to call off the war at the point Brent formed an H1 pinbar at last weeks high, you just have to have a reason to be in the market, manage your risk and make the most of opportunities when they come.

1644940449459.png
 
Last edited:
Stop moved to above recent lower high.

You know, trading is all about being in the right place at the right time, it is moves like this that will make the strategy.

I am not naive enough to believe price levels have amazing predictive power and the PTB decided to call off the war at the point Brent formed an H1 pinbar at last weeks high, you just have to have a reason to be in the market, manage your risk and make the most of opportunities when they come.

View attachment 313490

Exactly.

If trading the oils, you can also combine the volatility index chart. This will help confirm if we are in risk on or risk off condition.
 
If you use TradingView, it has a good feature that will auto draw previous weeks High/Low for you.

Ah, thanks for the tip.

I use TradingView for keeping tabs on various low cap cryptos that interest me but have not transitioned to using it as my main charting package being generally adverse to any kind of change but if it can save me time I shall consider it.
 
Oil - Brent Crude_20220222_09.09.png

Right place at the right time again and still going.

My intention of keeping a journal taking trades on hourlies while I have a full time job along with other things I have going on at the moment is proving to have been rather ambitious.

I don't expect many people will find a paper trading journal updated after the fact very interesting but it's for my benefit really. FWIW things are going rather well so far.

My crypto proceeds are currently stored in the form of gold sovereigns and if the gold price keeps going up (and my wife doesn't have them off me) we'll be looking pretty sweet.
 
Last edited:
View attachment 313809
Right place at the right time again and still going.

My intention of keeping a journal taking trades on hourlies while I have a full time job along with other things I have going on at the moment is proving to have been rather ambitious.

I don't expect many people will find a paper trading journal updated after the fact very interesting but it's for my benefit really. FWIW things are going rather well so far.

My crypto proceeds are currently stored in the form of gold sovereigns and if the gold price keeps going up (and my wife doesn't have them off me) we'll be looking pretty sweet.
I always plot out previous weekly high and low for my lower time frame trades as these are normally targets throughout the week and allows to form a general directional bias.
 
Just got an email from Shell informing me how much my gas and electricity is going up...oof.

I see a certain company offer spreadbets on UK inflation and the chart shows a downtrend since December. I am considering opening a modest long position if I see it bottoming out.
 
No trades recently, prices blowing through weekly levels like they are just imaginary lines on a computer screen, and it looks like it is going to get worse.

I am glad all my wealth is in precious metals.
 
If you sit tight you may be able to pick up Evraz and Polymetal shares for a couple of pence in the next few days.
 
Top