Pin Bars on the Weekly charts of Equities

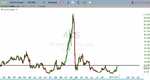
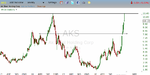
Only one for you this weekend (weekly / 5 day scan) GPN

Thanks Cigar.


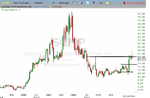
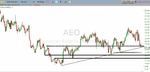
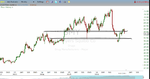
Taking one setup: Long NBD (buy@ market price on monday open).

Nice protruding pin bar, well formed with confluence, and with plenty of space to run.

Stop loss is 19.95, target is 21.50. I will watch and adjust according to how price reacts to the trouble areas shown.
 

Attachments

  • nbd.png
    nbd.png
    50.8 KB · Views: 293
Closing nbd for a breakeven , price tested and closed below the trouble areas shown . No setups this week, very busy with exams lol
 
Entering a short on SCMP, entry at market price, stop loss 17.17, target is 12.10


Entry at 15.42
 

Attachments

  • scmp.png
    scmp.png
    64.4 KB · Views: 200
Last edited:
Closed SCMP for a 10 cent loss, wasn't behaving as planned.

4 trades: 3 losses, 1 breakeven.

-2.5R

Entering two shorts on AKS and HDTL: AKS formed a good tailed pin bar (the body and close could have been better, but the resistance level which was broken was a massive pivot which goes back 20 years).

HDTL formed a nice bearish hammer (almost a pin bar, closer to an engulfish bar), off resistance.

Target for AKS is the gap fill at 7.60, entry at market and stop loss 11.40.
HDTL entry at market, stop loss 22.47, target 20.10.
 

Attachments

  • htld.png
    htld.png
    38.4 KB · Views: 249
  • aks ppz.png
    aks ppz.png
    49.6 KB · Views: 232
  • aks.png
    aks.png
    47.7 KB · Views: 247
After some discussion with a trader who is teaching/mentoring me, we have decided it's now time to add a few more tools to my trading toolbox, which i've been researching and testing plenty.

From now on I will be using MACD as a divergence indicator, and will also be adding bearish and bullish engulfing bars to my setups.

Performance so far has been worse than expected, though by no means is 4 trades a large enough sample size. I am confident after a year's trades the positive expectancy should begin to reveal itself. I look forward to implementing these new tools.
 
Last edited:
As an example of how I plan to use outside bars with the Macd: see ANW which I am hoping closes good this Friday, cracking setup IMO.
 

Attachments

  • ANW.png
    ANW.png
    83.2 KB · Views: 251
Placing a sell limit order on ANW, entry at 10.20: Bearish outside bar which closed under a swing high, coupled with MACD divergence. Stop loss 11.70 (150 cents). Target 8.60 (160 cents).

For AKS, I am closing the trade given price tested a recent gap fill which acted as support (note to self, gaps should be treated as s/r), for a small -45 cent loss (-0.35R)

- 2.85R overall so far
 

Attachments

  • ANW1.png
    ANW1.png
    51.5 KB · Views: 236
Placing a sell limit order on ANW, entry at 10.20: Bearish outside bar which closed under a swing high, coupled with MACD divergence. Stop loss 11.70 (150 cents). Target 8.60 (160 cents).

For AKS, I am closing the trade given price tested a recent gap fill which acted as support (note to self, gaps should be treated as s/r), for a small -45 cent loss (-0.35R)

- 2.85R overall so far
Correction , my sell entry for ANW is 10.50 not 10.20
 
It goes without saying that taking trades this week is pretty pointless , so no setups this week , back to business next week though !

HTLD is very close to the target area , and ANW has pinged right off my sell entry area, so looking good .
 
It goes without saying that taking trades this week is pretty pointless , so no setups this week , back to business next week though !

HTLD is very close to the target area , and ANW has pinged right off my sell entry area, so looking good .

I'm closing HTLD now , exiting on the ask (20.40) . This is due to it nearly being the market close and price likely to close just above a minor support level on the weekly . This gives a +1 R gain (slightly more, but let's allow for some slippage )

-1.85R running total . Let's see if my simulated equity curve can hit a winning streak ��
 
Last edited:
Just before the market closes, im entering a new short on AEO: bearish outside bar right on the big weekly trendline, hinting towards a breakout. Entry a few ticks below the trendline (sell stop at 14.45), stop loss 15.50) target is 13.35) (1R)
 

Attachments

  • aeo pre emptive breakout.png
    aeo pre emptive breakout.png
    72.4 KB · Views: 530
Last edited:
Just before the market closes, im entering a new short on AEO: bearish outside bar right on the big weekly trendline, hinting towards a breakout. Entry a few ticks below the trendline (sell stop at 14.45), stop loss 15.50) target is 13.35) (1R)


Stopped out on this one. -2.85R


entering a short on BMY, entry on retrace to 57.50, stop 60.10, target 53.00

In time I may add my daily chart fx trades, which are doing much better than the stock picks so far!
 

Attachments

  • bmy.png
    bmy.png
    76.3 KB · Views: 233
Also entering a long trade on PRI, bullish outside bar closing over resistance, buy on pullback to 73.40, stop loss 70.11, target is simply 2:1 r/r
 

Attachments

  • pri.png
    pri.png
    70 KB · Views: 267
Went long Friday close on a currency ETF of EURAUD. Entry on open last night , stop below pin , 2:1 r/r target

Setup is a simple weekly pin bar coupled with MACD divergence
 

Attachments

  • image.png
    image.png
    103.5 KB · Views: 237
Last edited:
Also entering a long trade on PRI, bullish outside bar closing over resistance, buy on pullback to 73.40, stop loss 70.11, target is simply 2:1 r/r

Trailing stop loss on this trade to 71.40, around 0.5R
 
Went long Friday close on a currency ETF of EURAUD. Entry on open last night , stop below pin , 2:1 r/r target

Setup is a simple weekly pin bar coupled with MACD divergence

Closing this trade for breakeven
 
New trade long on STX , entry 4175, stop 3814, target 4881.

I also cancelled the Short on BMY as it fell hugely without pulling back
 

Attachments

  • image.png
    image.png
    93.7 KB · Views: 243
Top