You are using an out of date browser. It may not display this or other websites correctly.
You should upgrade or use an alternative browser.
You should upgrade or use an alternative browser.
Gring0
Well-known member
- Messages
- 264
- Likes
- 128
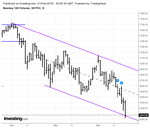
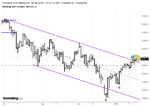
Price has exited the bottom of the hinge. Hasn't been much demand since the bounce from the apex. So far strength is missing. The 6480.75 was the low. We're heading that way now.
The Mar `18 contract showed 6480 while the investing.com free chart shows 6449 as the low. I have been looking into live futures and it's a pain to see contracts that aren't continuous. Prices are a bit off as well. Doesn't matter in the bigger scheme of things but will take some getting used to.
Gedigan
Junior member
- Messages
- 19
- Likes
- 4
Merry Christmas Everyone.
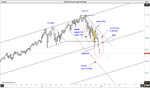
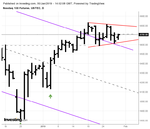
First I'd like to apologize for my short comment above (#376). I meant no dis-respect to you guys. My feeble attempt to inform those who will listen to price action & what was about to happen next after ending price action. I've labeled what I see as pre-supply & BC in the chart below. Then added the UT because it's there. As anticipated we are now in the SOW phase of the Wyckoff schematic. Once the low is put in, we need a TR for the next move.
Cheers
Gedigan
Attachments
Last edited:
Gring0
Well-known member
- Messages
- 264
- Likes
- 128
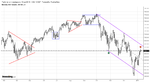
Price is around 6600 where the good old hinge from last year has its apex. It's also where previously there was a bounce. It doesn't mean it's a guarantee but those trading based on behaviour of price can pay attention and take advantage of it. At least one won't be surprised if supply starts to show up around here.
Attachments
Last edited:
Gring0
Well-known member
- Messages
- 264
- Likes
- 128
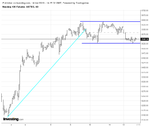
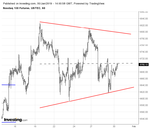
NQ at the top end of the trend channel. So far there hasn't been much weakness on the way up. We must also keep in mind the steep price drop close to 5800 and then a test and continuation. It very well could be the bottom but we have no way of knowing. Around here I am eyeing any potential weakness (even if it is temporary).
Attachments
Lindsaybev
Junior member
- Messages
- 31
- Likes
- 7
Hello, DBPhoenix! Hope you are well.
I am still working on the back testing. It has been very helpful in allowing me to set up some rules for trading. However, it seems the act of repetition has also been exceedingly helpful.
I do have one area that continues to confuse me a bit. It is the area from January to February 2018 on the Daily. There have been plenty of charts posted here that don't change the TL to account for this rather large piercing of the Upper TC line. In fact it pierces it again, even higher, making it look like a total change in trend.
I could not find pictures of that area and the trend channel as it was happening, but rather find all the posts with the rather large piercings of the TC line and the TC line down under it, after the fact. How would I know at the time this was happening that this was an unusual move outside the trend? Would I not know and just readjust the line at a later date??
Did you have your Upper TC line going off into outer space at one time, and then reel it back in at subsequent lower highs?
On a different note: I have been quiet, but I am watching the market closely. Interesting area it seems we are in now. I had been wondering if volume on 12/21 had been the "ultimate" climax to change the direction. Then that bar on 12/26, the longest and strongest UP bar of the entire move seemed to echo that sentiment. It made me go back and read about V and W bottom formations again. V's are not to be trusted in general. A more typical W should be expected. Now we are at the upper TC line and curling over...a continuation of the downward trend...or the second half of a W formation? Fun to watch and learn.
Hello, Gring0! Hope you are doing well, too!
Last edited:
NQ at the top end of the trend channel. So far there hasn't been much weakness on the way up. We must also keep in mind the steep price drop close to 5800 and then a test and continuation. It very well could be the bottom but we have no way of knowing. Around here I am eyeing any potential weakness (even if it is temporary).
Hello gringo! I am also looking for a potential short here, what kind of setup do you look for or are you alrady short? I normally wait for the standard SLA break of dl * lower high on the daily do you look for the same setup¿?
Cheers!
dbphoenix
Guest Author
- Messages
- 6,954
- Likes
- 1,266
I do have one area that continues to confuse me a bit. It is the area from January to February 2018 on the Daily. There have been plenty of charts posted here that don't change the TL to account for this rather large piercing of the Upper TC line. In fact it pierces it again, even higher, making it look like a total change in trend.
I could not find pictures of that area and the trend channel as it was happening, but rather find all the posts with the rather large piercings of the TC line and the TC line down under it, after the fact. How would I know at the time this was happening that this was an unusual move outside the trend? Would I not know and just readjust the line at a later date??
View attachment 259643
Since so few people are drawing these lines correctly, I suggest you focus on the book and on Wyckoff's course with regard to trends and trendlines rather than posts since one must have a proper understanding of trend in order to determine the line of least resistance, and if one can't determine the line of least resistance, then he pretty much has nowhere to go. At least in terms of trading price.
Wyckoff drew these channels to provide a graphic display of overbought and oversold conditions, defined as those which rise above or drop below the channel. Altering the trajectories of the upper and lower limits of the channel should be done only if absolutely necessary. Otherwise, all that information regarding overextension is lost and the channels become relatively useless. Knowing when to alter these channels in real time is challenging but not particularly difficult if one focuses on price movement and the lines that price movement creates rather than try to shoehorn price movement into inflexible channels.
This particular channel originated in 2016, specifically with the demand line drawn from February '16 to June '16. Draw a parallel supply line to create a channel. This will stretch from April '16 to August '16 and beyond. Extend this line. Traders break through it the following February. Is this line tested afterward? When? What is the result of the test?
Db
barjon
Legendary member
- Messages
- 10,752
- Likes
- 1,863
Slightly off piste the October/December down move retraced almost smack on 50% of the long up move that started in Feb 16. We recovered about 50% of that down move and backed off from it on Tuesday only to get back to it again yesterday. At an interesting point.
The extent to which one exercises patience is in direct relation to how well he understands what it is he's waiting for.
Bravo! Bravo! Bravissimo!
Lindsaybev
Junior member
- Messages
- 31
- Likes
- 7
Howdy. Hope everyone is well. Still working on my rules.
I have a question about ranges (more like chop on my daily chart). I am trying to practice "narrating" what is taking place on a chart, trying to decipher who is running the show at each point. Upward and downward action is a lot easier, obviously, than sideways.
For an example, let us say that the Daily chart is currently in an uptrend trend, and I have a DL in place. Then at some point the DL gets crossed over, but price does not turn down, it then travels more or less sideways. Knowing that it is normal and healthy for there to be pullbacks on an upward trajectory, so even a downward traveling price is ok (at least in my current rule of using the halfway point as a barometer of how far I will allow price to travel before getting out)....what should I think of sideways movement?
I am calling it chop as there is not enough of a range to trade it on a daily chart...but neither is it falling. Just wonder if this is showing more strength at an area where people are "searching for equilibrium" vs. a break and then the price travels downward.
Hope all you day traders enjoyed the big run yesterday!
I have a question about ranges (more like chop on my daily chart). I am trying to practice "narrating" what is taking place on a chart, trying to decipher who is running the show at each point. Upward and downward action is a lot easier, obviously, than sideways.
For an example, let us say that the Daily chart is currently in an uptrend trend, and I have a DL in place. Then at some point the DL gets crossed over, but price does not turn down, it then travels more or less sideways. Knowing that it is normal and healthy for there to be pullbacks on an upward trajectory, so even a downward traveling price is ok (at least in my current rule of using the halfway point as a barometer of how far I will allow price to travel before getting out)....what should I think of sideways movement?
- Is price showing an area where Buyers are no longer willing to buy, stopping the upward movement, and therefore weakness....
- Is price showing an area where Buyers are supporting it at that area and an inability of supply to push the price downwards, and therefore strength?
I am calling it chop as there is not enough of a range to trade it on a daily chart...but neither is it falling. Just wonder if this is showing more strength at an area where people are "searching for equilibrium" vs. a break and then the price travels downward.
Hope all you day traders enjoyed the big run yesterday!
Last edited:
Lindsaybev
Junior member
- Messages
- 31
- Likes
- 7
One last Q: Am I supposed to be transferring my Trend Lines from the Weekly onto the Daily....and also doing Daily Trend Lines on the same chart? Or should I be doing each separately on their own charts (this is how I have been doing it)?
Gring0
Well-known member
- Messages
- 264
- Likes
- 128
The trend has been up. There isn't much to do unless conditions change. If one's in, one sits; and if one's out, one again sits. I have learned over the years that forcing the issue and conjuring up shapes in the clouds usually ends up being costly. When the time is right it is every so easy to realize what needs to be done. The trick is to let price get to that ripened state.
Last edited:
Similar threads
- Replies
- 0
- Views
- 2K