Trading the ES (E mini) December 2003

stoploss please

Established member
Messages
780
Likes
10
Sand

What did you make of todays PREM. Was it confusing or was it just me.

China

The sox looked really weak in relation to the ES today through out this slow move up. Really off putting.
 
Sox as leading indicator

China buddy

The Sox looked weak today and seemed to drag down the ES. However, through out its drop, the MACD of SOX was giving positive divergences. The 200 MA was the place were both the SOX and ES stopped there declines.
 

Attachments

  • dow 5min142.png
    dow 5min142.png
    13.7 KB · Views: 1,120
Todays tick EMA analysis

Hi

Trend line breaks denote denote trades. Blue longs and red shorts.
 

Attachments

  • dow 5min143.png
    dow 5min143.png
    18.5 KB · Views: 1,104
Stoploss,

TBH I found lots of things everything confusing today, what with sorting out this charting malarky. Wasn't watching a lot real-time other than to try and do some benchmarking to check how "real-time" this new feed is.

As I look at prem (hey, should finally be the same as yours) now it doesn't seem overly confusing (but hindsight is a wonderful thing ;)). Whether it would have made sense at the time, I don't honestly know.

Anyway, a brief summary. See if you agree.

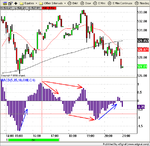
14:38-14:40 prem hits threshold sell program levels. Cash is down, e-mini is down. prem is obviously below fv. Conclusion: futures led move. Action: long. Level: Anywhere you like but when prem hits threshold program sell level you are getting value.

14:40-14:59 cash and e-mini move up. prem predominantly below fv. Conclusion: cash led move. Action: hold long.

14:59-15:01 cash and e-mini surge. prem surges above fv. Conclusion: futures led move. Action: ready to exit long (maybe short depends how aggressive you are). Level: Anywhere, but when prem hits "active" buy program level it's as good a spot as anywhere.

15:01-15:10 cash and futures retrace before heading back up (also accompanied by 0 TICK bounce). Threshold buy program level hit by prem at 15:10 and then prem holds above fv. Conclusion: Unsure.... ;) Don't honestly know whether I would have taken the TICK 0 bounce or not.

15:15-15:49 prem hits buy program threshold again and a move down begins with prem > fv. Conclusion: cash led move. Action: Short. Level: Please yourself..... ;)

After that, it gets messy (just as you said) with what looks like a long drawn out futures led crawl upward. For me personally, it's outside the first 90 minutes and so I wouldn't bother trading it.

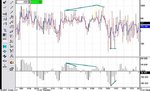
The 16:34 bar on prem would have alerted me to the possibility of something happening. But when nothing developed it would been back to sleep until that "swing" in prem that happened between 18:23 and 18:31.

If you caught the short then prem below fv on a move down should have kept you sharp (expecting a reversal). prem hitting the threshold sell program level at 19:17 was a reasonable point to exit your short and possibly reverse. I would have been looking to exit, or protect the position up till 19:35 simply because prem was trading above fv indicating a futures led move.
When the threshold buy program level was hit by prem at 19:35 I would have exited any long.

The rest of the session looked like it was futures led so even if I had traded it, I would not have been expecting much from it.
 
trading worth of Trotters Independent Traders

lads/lasses

brilliant example of how trading on a system actually makes any sense at all only if u actually TRADE on it :devilish:

sussing the final bit of using high-beta indices' macd of cash to sift out 2 tops/bottoms (those short of 3 necessary for a proper div sequence) was quite "enlightening", which makes me even more p1ssed-off at meself for not trading on it!!!!

A surgical short @ 1068.50 on a complete tick neg div at upper 1st hr pivot with neg divs across indices was giving a nice win of 6.5 pts at 14:15ish

Then I get macd of cash pos div on Comp (even better on SOX - brilliant chart mate) at 1062 - lower pivot + former res resolved into a sup - and do nothing.... :rolleyes: "U r a 24 carat plonker Rodney, u really r!" Quote from Delboy :cheesy:

definitely need some tequila here.
 
stoploss - luvd yr last msg on November board mate :) sounds like Mr Bond - "felix will fix it" :)
 
Todays tick entries

China buddy

I think I am getting a hang of your system.

The divergences are there to see in the MACD.

(A) is a trend line break.
(B) is a fade up.

The big collapse was not signalled by a divergence however, we had negative divergences across the board in Tick, SOX and BIX MACD.

I am trying to look for H&S in the TICK ema as they show up the points in your Tick divergence.

How did you read the start of the big sell off.

Cheers
Andy
 

Attachments

  • dow 5min147.png
    dow 5min147.png
    20.6 KB · Views: 1,057
Tick report 12-02

stoploss - very good chart.

this is how I c it:

after 1st hour (no-trend day) we fade upper pivot @ 68.75. Which per system shud've bn reversed at lower pivot which wud've bn the right move. however, u need to be careful on set-ups where the 1st hr range is so tight. I took 1.5 pts and covered w/o reversing.

The rest is clear from Tick graph. Note we had 2 set-ups where tick spikes/lows were equal, and therefore macd of tick div vs tick and tick div vs ES wud be happening simulataneously.

Note also another luvly example of an "imbedded" tick div sequences. U do sell the shorter one (well thez no way to tell abt the longer one at that pt, is there? :cheesy: ) with a tight stop of 1.5 pts and trgt of same 1.5 pts. Then u sell the larger one, actually also with a tight stoploss, since there were no macd of cash divs on high-beta indices, and tick had bn constantly >0 over the entire duration of the sequence
 

Attachments

  • tick1202.jpg
    tick1202.jpg
    53.3 KB · Views: 994
The ES

B was a long at support.

C was a short after a pop over the previous days high.

A, B and C also had another thing in common. The MACD in the Tick, SOX and BIX pointed the way.

The end of the day was a mess.
 

Attachments

  • dow 5min150.png
    dow 5min150.png
    27.6 KB · Views: 882
word of caution if i may

today we had the narrowest range in 7 days. Tomorrow's direction of gap open will most likely define a strong trend in the same direction. Which i am afraid will be up which in turn will ignite a psycho rally, anywhere up to 1150 :)

however, I still hvnt got mcClellan for the last session but I suspect it's gonna be a minor change down. Just be alerted. :)
 
Re: The ES

stoploss please said:
B was a long at support.

C was a short after a pop over the previous days high.

A, B and C also had another thing in common. The MACD in the Tick, SOX and BIX pointed the way.

The end of the day was a mess.

Nice analysis SL. Well done.

Keep up the good work :D
 
lads disregard the last bit of my most recent msg. NYSE McClellan for 02-12 is -10.65 so it's not a mcclose set-up for 03-12
 
completely off the topic of this thread.

it is only 9:13 pm here in mexico do I am excused for posting these late msgs :)

not implying anything or drawing any conclusions WHATSOEVER this bit struck me:

quote:

By December 94 the red ink hidden in account 88888 totalled $512 million. Getting increasingly desperate Leeson bet that the Nikkei index would not drop below 19,000 points. At the time this seemed reasonable as the Japanese economy was rebounding after a 30-month recession. Then on the 17th January 1995, a devastating earthquake measuring 7.2 hit the Japanese city of Kobe.

The previously stable Nikkei index plummeted by 7% in a week. As the losses grew, Leeson requested extra funds to continue trading, hoping to extricate himself from the mess by more deals. Leeson was counting that there would be a post quake rebound and the Nikki would stabilise at 19,000. There was no hedges, no bets the other way to protect Barings' huge exposures. There was no rebound. Over three months he bought more than 20,000 futures contracts worth about $180,000 each in a vain attempt to move the market. Some three quarters of the $1.3 billion he lost Barrings resulted from these trades. When Barings executives discovered what had happened, they informed the Bank of England that Barings was effectively bust.

end of quote.

just be on your toes mates.
 
Boys,
Firstly thanks for the brilliant thread - it's made me pay a lot more attention to the internals which I should've been doing long ago.
I have kept an eye on the Tick in the past as an overbought/sold meter but never thought of using it as an indicator in it's own right til China gave us a peek at his system.
Now, something I have noticed over the last few days and might be worth a mention is hidden divergence on the Tick -(where Tick has LL and ES has a HL in an uptrend - vice versa in a downtrend) - this has given quite a few decent signals recently to jump in for a few points with the current trend where Maybe you missed an initial signal, or just as a confidence booster to stick with the trade when the going gets a bit shaky.
Any thoughts on this?
As I said I've only been watching the Tick closely the last week or 2 so apologies if I'm talking cojonies (do they say that in Mexico? :D ) but I thought I'd bring it up anyway...
 
4/12 Tick

Interesting day, China, it would be good to hear your view.

(a) was a + MACD Tick / ES divergence.

(b) I did not spot this one as the MACD
told me nothing but you can see the HLs
being made by the Tick.

(c) - MACD Tick / ES Divergence

(d) + MACD Tick / ES Divergence

(e) The MACD not so clear cut here but the SOX and the BIX showed direction. Looking at the SOX and BIX, would have given you am earlier entry.

(f) + MACD Tick / ES Divergence but only scalp. Just look at (d) and (e) MACD lows.

(g) and (h) - MACD Tick / ES Divergence
 

Attachments

  • dow 5min155.png
    dow 5min155.png
    135.7 KB · Views: 710
Last edited:
mark_m,
Agree 100%. I have learnt so much from this thread other the past few weeks. I'll now get all the posts and charts out again and have a look at them from your perspective. Cheers
hampy
 
Top