You are using an out of date browser. It may not display this or other websites correctly.
You should upgrade or use an alternative browser.
You should upgrade or use an alternative browser.
Trading the ES (E mini) December 2003
- Thread starter stoploss please
- Start date
- Watchers 7
stoploss please
Established member
- Messages
- 780
- Likes
- 10
Hampy
Yes mate, its 7.5. I find these colours are easier to the eye.
Yes mate, its 7.5. I find these colours are easier to the eye.
stoploss please
Established member
- Messages
- 780
- Likes
- 10
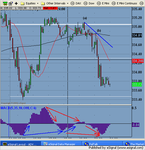
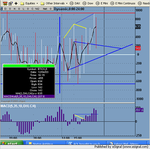
BIX
The big white line is the Pivot.
Looking for
BIX against ES price divergence in price
BIX against ES price momentum indicator in the price
Look for MACD against price divergence or momentum in BIX
At (a) we had a bearish engulfing pattern after a LH at the pivot.
At (b) we had an ugly hanging man.
We need more input guys and girls and if you disagree, can some one please say so. Come back mma.
Attachments
stoploss please
Established member
- Messages
- 780
- Likes
- 10
china white
Established member
- Messages
- 979
- Likes
- 12
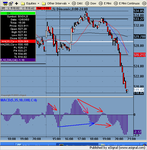
03-12
wudnt u lads/lasses like dancing round "big figures" every day? :cheesy: ok - 21.25 pts on the plate out of which 15.5 per system, 4 from a punt that went right (not recommended) and 1.75 from scalping (fine tuning to the sys).
ok - first dont look at yellow lines - brilliant analysis by Stoploss - which worked very well today, and which, in all honesty, I hvnt bn paying proper attention to b4.
FIRST - let me emphasise it again! - macd of tick is not reliable in the 1st hr for the reasons discussed in Nov thread. U'll c a red line which looks very nice in hindsight bit which IS curve-fitting. I' advise avoiding it.
Tick neg div right b4 numbers out. A COMPLETE AND UTTER PUNT. S about 1071.50 with a tight stoploss. goes yr way - good start for the day. No dicouragement allowed if u go for such an early punt and get stopped-out tho - u know u r horse betting here, not really trading :cheesy:
10:30 - we r at LP with slight neg divs across indices with a chiselled tick pos div. U wud ideally want to buy LP from below when techs r lagging, but given "2K magnetism" very reasonable rev to L @ 67-67.50
some scalping opportunities round 1070 (not marked on chart) but given the "glow" of 2K probably not worth it. I personally never saw "big round figures" left untouched on an inflection.
Obvious scalping activity in the lunchtime :cheesy: Till we get "figure" on tick neg div and neg divs across indices. tell u what - if not for 2K - per system it'd be selling UP (1072). However, here we nicely rev to S @ 73.75.
By 13:50 full tick pos sequence brings us back to 1074 re-test on ES. U'll c a light green line on my chart. Allowed for longer term tick neg div, but with a loud screeching sound 😀 WHAT U SHUD REALLY BE LOOKING FOR HERE TO REV TO S is that ES re-tests HOD but the shining star Nasdaq fails to re-test 2K. Confirmed by Macd of cash neg divs across ALL high-beta indices.
And that S u close in the last hour (c chart). Voila.
Now for the yellow lines - courtesy of Stoploss. U can c how well applying R/S and S/R switches to Tick MAs worked today. The break of the 2nd switch was a clear rev to S signal.
Attachments
china white
Established member
- Messages
- 979
- Likes
- 12
mark_m
brilliant thot. I'll need to back-test it. I've got the feeling thez something big in it 🙂 cheers matey
brilliant thot. I'll need to back-test it. I've got the feeling thez something big in it 🙂 cheers matey
frugi
1
- Messages
- 1,843
- Likes
- 133
Thanks for a stunning thread people; in fact I should probably say basket of threads: the tireless work and continual selfless supply of sharp market insights from Chartman, Skim, China, Sandpiper, Stoploss, Grey1, Trader333, Bonsai etc. etc. (you know who you are, generous people) makes for absolutely superb reading and tuition. 😱 I'll stop before I get too emotional! 😀
Anyway, I opened my IB account today (took a week from first line of application to first trade, very happy with their service so far). Love it. Real trading with real traders, at last. Apart from my failing to notice the size wand slyly increase a position that then went against me! I closed 1 lot and then wondered why I still had 1 lot open. Meanwhile one of you clever lot pinched $100 from me! Oops, won't do that again. 😀
Vine-enriched rambling aside, I have been dabbling with my crude and amateur interpretation of China's/Stoploss' system, with the usual pivots and a whiff of Chartman's 3 pk RSI divergence thrown in for good measure.
Looks pretty good in hindsight today...will be curious to see how the next few days unfold. Sorry the chart's so wide and of course if I'm barking up a particularly pointless tree I'd be glad to know!
I'd better roost before I fall asleep in the laptop!
Last edited:
stoploss please
Established member
- Messages
- 780
- Likes
- 10
Frugi
This is my mates Chinas system. I just asked a few questions.
Cheers
Andy
This is my mates Chinas system. I just asked a few questions.
Cheers
Andy
stoploss please
Established member
- Messages
- 780
- Likes
- 10
China
Have you thought about going over to a volume weighted rather than an expo on the tick.
Have you thought about going over to a volume weighted rather than an expo on the tick.
stoploss please
Established member
- Messages
- 780
- Likes
- 10
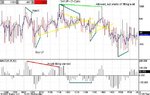
Does this make sense
China
The break of A was the attempt to surpass the days high. As we all know now, it infact made a LH.
What interests me is the position of that long red tick. We started at a LL on the tick. Should this indicate that A was going to fail.
I also like the geometre of these LH ticks.
China
The break of A was the attempt to surpass the days high. As we all know now, it infact made a LH.
What interests me is the position of that long red tick. We started at a LL on the tick. Should this indicate that A was going to fail.
I also like the geometre of these LH ticks.
Attachments
china white
Established member
- Messages
- 979
- Likes
- 12
Stoploss
if u think carefully matey - not at all imo. think about the regular 3 pt tick sequence, say positive. U WANT to have a lower 2nd trough on the Tick (with rising macd of Tick) to be followed by HL of Tick with LL on ES. So by itself I think it does not tell u anything about the strength of the up sprint after the turn.
regarding volume weighing - I'll hv to think. Can't answer off the top of me loaf 🙂
and c'mon matey u've already contributed so much to the sys! 🙂 I wud not tolerate escessive shyness in a trader! - LOL
stoploss please
Established member
- Messages
- 780
- Likes
- 10
Shy, me. LOL.
stoploss please
Established member
- Messages
- 780
- Likes
- 10
Sandpiper
I am still looking at the PREM but trying to master what I am doing with this MACD, Tick divi thingy first. Also, I only have a two screen set up at the mo, which makes things difficult. I plan to upgrade to three screens next week.
Andy
I am still looking at the PREM but trying to master what I am doing with this MACD, Tick divi thingy first. Also, I only have a two screen set up at the mo, which makes things difficult. I plan to upgrade to three screens next week.
Andy
stoploss please
Established member
- Messages
- 780
- Likes
- 10
Question about IB brokers and the size of the emini contract. At the mo, I am using IG to trade their S&P Future contract. I was reading on IBs site that the size of the contract is $50 times the price of the ES. ie $50*1067. Is that right. I thought that the E-mini cost $3000 and there was a $50 increase or decrease per point movement.
Cheers
Andy
Cheers
Andy
frugi
1
- Messages
- 1,843
- Likes
- 133
You're right. The ES contract (per lot) moves $50 per whole point.
If the ES are at 1067 the notional value of a one lot position is $50*1067 = $53350. However you only need put up a fraction of this in margin.
You need a minimum of $2000 to open an account and to open a 1 lot position. If it goes against you they require a certain amount of maintenance margin. Margin requirements double after 8.45pm thru overnight.
http://www.interactivebrokers.com/html/marginRequirements/index.html
stoploss please
Established member
- Messages
- 780
- Likes
- 10
Cheers frugi, that makes more sense.
stoploss please
Established member
- Messages
- 780
- Likes
- 10
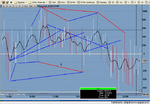
4/11 AM
I was looking for a MACD Tick Divergence to the downside. Yellows lines denote this. Hoping to short at 1067 area.
We made to HLs and then broke the resistance line.
The horizontal red lines are todays Tick high and low. It helps with perspective.
I was looking for a MACD Tick Divergence to the downside. Yellows lines denote this. Hoping to short at 1067 area.
We made to HLs and then broke the resistance line.
The horizontal red lines are todays Tick high and low. It helps with perspective.
Attachments
stoploss please
Established member
- Messages
- 780
- Likes
- 10
stoploss please
Established member
- Messages
- 780
- Likes
- 10
Similar threads
- Replies
- 3
- Views
- 4K