Trading Stock Indexes

4xis2ez

Well-known member
Messages
372
Likes
54
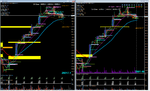
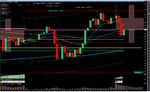
I funded my Nadex account with a little bit of money and look to trade stock indexes using my cycle analysis. Already 2 good trades today.

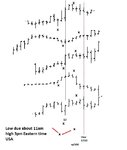
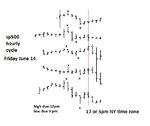
Here is my cycle work right now. Looking for a slight down move mid week, but most money will be made on the long side I believe.
forum2.jpg
 

Attachments

  • forum3.jpg
    forum3.jpg
    36.6 KB · Views: 349
  • forum.jpg
    forum.jpg
    38.1 KB · Views: 293
Last edited:
  • Like
Reactions: 2be
Closed Nadex short for profit. Probably flat rest of the week unless fundamental info suggests more down side movement.

forum.jpg
 
Intraday cycle for SP500 shown here. These are hourly bars of historical data at specific intervals that predicts future price movement. Looking to trade SP500 short Wednesday around 12pm eastern time USA.

forum.jpg
 
I am shorting DOW from last session close 26050 level
larger SL to start with
 
will close at around round number- data release Oil
 
repeated the first trade. reason. hidden divergence on DOW down the from war zone (last session close)
 
50 + pips moves on DOW atm for intra day /scalping seems to be the range both ways, I am taking only shorts,
though there is a positive divergence on volume candles set to 444 on dow away from the resent session Low, not taking that long.
 
All shorts covered at 5973 level, S 50% Fib daily Pivot of the US session PA only, and positive divergence on Vol 444 candle charts.
Time for a break.

There is some more space for shorting IMHO but I have not established mid term position for a time being.
Will consider Long around 17th as 4xis2ez has indicated
 
Last edited:
Trying to workout some buying zones on DOW
25426/25436 fibs and monthly fib pivot is one possibility
25046 is 38.2% Weekly fib pivot - setting BUY market order for futures - very likely it will not be triggered, but if it will I will build that position and hold for days.
25580 weekly pivot and S23.6 @25250 Fib weekly pivots are to be considered
These are not targets, just some possible zones to go long on DOW

A bit of a slow day so far, good pips have been bagged on intra day and few scalps.
Have had some breaks too, so...tomorrow no high impact news, unless there is a significant Tweet...
will be watching the normal levels
Good trade 2be. My trade only managed a few $. Waiting till next week to go long.
 
For whatever it's worth, here is my hourly cycle analysis for Thursday of SP500. I may trade or not.
 

Attachments

  • spx thu 5pm.jpg
    spx thu 5pm.jpg
    48.9 KB · Views: 315
Trend held well from yesterday's US session.
Some levels for tomorrow for S&P and DOW
added DOW Renko set to 444 ticks US session PA only
Observe trend continuation, I have it open alongside other charts and follow some other things like Crude and USD index
Move the chart to see the dates at the bottom, otherwise is difficult to make any sense of it.
Renko chart is set to NYSE session (in UTC , not EST) indeed many of my charts are set to session time only, though I do also have continuing charts too, but prefer the session time PA only, for indices it works for me better, not for Forex.
 

Attachments

  • S&P  DOW US session close M30 2019-06-12_233733.png
    S&P DOW US session close M30 2019-06-12_233733.png
    105.7 KB · Views: 265
  • Renko Tich 444 2019-06-12_234435.png
    Renko Tich 444 2019-06-12_234435.png
    80.9 KB · Views: 350
  • DOW Renko Tick 444 2019-06-12_234756.png
    DOW Renko Tick 444 2019-06-12_234756.png
    133.2 KB · Views: 269
Last edited:
price of crude an important factor today
be on guard, and rootless with SL, it might be volatile
Mr Abe has got some balls to juggle, apparently these two tankers are related to Japanese interests, so a well disguised welcoming for him on his journey to the region.
 
Last edited:
done for the day - on DOW Gap to last session closed.
As posted yesterday M30 US session charts post No: 15 on this thread
Good fast pips
There was a divergence (esp well indicated on volume candles US session only) at the session top and down from pivot's map
This type of gap has a good rate of closing it, at least partial closure, today it has close well and reacted to the round number.
There is still a lot of time for DOW to make a substantial move down, watch Fri, with added scenario in the Gulf.
 

Attachments

  • S&P  DOW US session close M30 2019-06-12_233733.png
    S&P DOW US session close M30 2019-06-12_233733.png
    105.7 KB · Views: 233
  • DOW US session M30 Gap closed 2019-06-13_162723.png
    DOW US session M30 Gap closed 2019-06-13_162723.png
    60.8 KB · Views: 198
Last edited:
Intraday cycle for Friday June 14 of SP500


Attachments

  • spx fri june 14.jpg
    spx fri june 14.jpg
    38.1 KB · Views: 199
Updated cycle analysis using 30 minute bars rather than 60 minute. This is for day trading and gives the approximate timing of highs and lows. All times listed are NY time zone.

forum.jpg
 
Top