In November of 2016 Americans will choose a new president. A detailed study of history can give us some interesting clues on how the USstock market might behave regardless of who wins.
Many market analysts have noted a general tendency for the stock market to experience a meaningful price bottom roughly every four years. Of course, the exact timing from low to low does not always correspond to an exact four year cycle. Still, there does appear to be some correlation between the action of the stock market and the four year period that extends from one presidential election to the next. This is most commonly referred to as the “Election Cycle.”
The Election Cycle
The “Election Cycle” as generally defined, consists of the Post-Election, Mid-Term, Pre-Election and Election years.
Figure 1 shows that there seem to be some meaningful differences in both rates of return and winning percentages in each of the election cycle years. The first two years the of the cycle tend to be weaker than the last two, with the post- election year being the weakest year and the pre-election year the strongest.
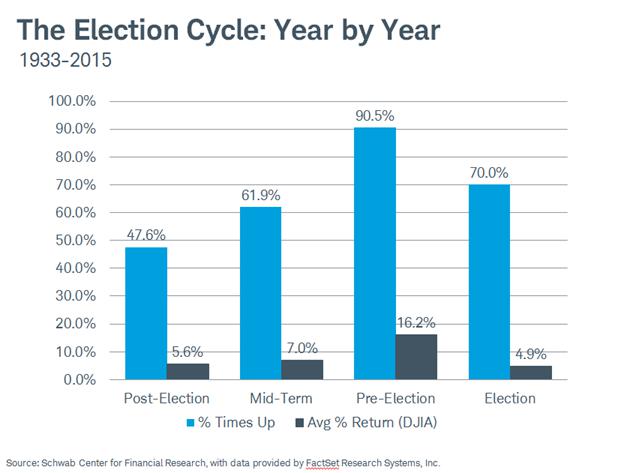
Figure 1.
A year-by-year analysis can provide further insights.
Post-election year
The post-election year has historically been the weakest of the four in terms of winning percentage, and the second worse in terms of net annual gain. Some analysts attribute this to the president tackling the most painful economic initiatives early in his or her term so that times are better when the next election rolls around. It is interesting that many major bear markets have started in the post-election year, specifically in 1929, 1937, 1957, 1969, 1973 and 1981. Also, some major wars have started in the post- election year as well: 1861 (the beginning of theU.S.Civil war), 1917 (U.S.entry into WWI), 1941(U.S entry into WWII) and 1965 (Vietnam War).
Examining Figure 2, we can see that stock market performance during Post-Election years can best be described as “all or nothing.” To put it another way, whichever way the market moves, it tends to move in a meaningful way. While Post-Election years have a mixed record of up vs. down years (48/52) what is interesting is that all of the “up” years generated a double digit gain, and six of the ten “down” years generated a double digit decline.
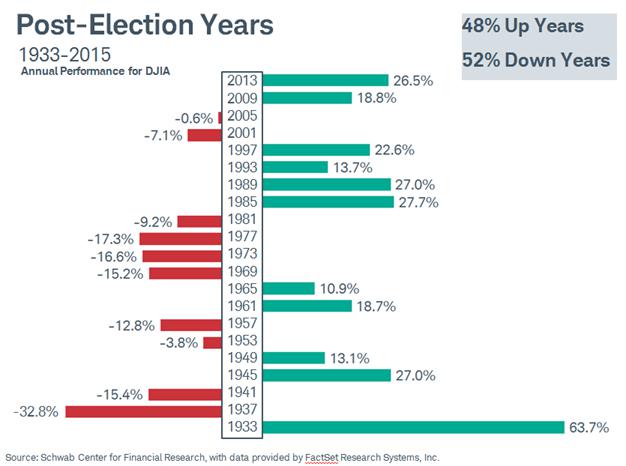
Figure 2.
Mid-term election year:
Mid-term election years tend to have a higher winning percentage (62/38) than post-election years. The average rate of return is higher as well, although the average and median annual returns (+7.0% and +6.2%, respectively) are both below the long-term annual average of roughly +9%. Also, much like the Post-Election year, the Mid-Term Election year tends to experience large price movements. The annual Mid-Term year has posted a gain of +10% or more nine times and a loss of -10% or more four times. (Figure 3). It is also worth noting that, even though the mid-term year has only been down 38% of the time since 1933, some of the losses were quite substantial, including -16.8% in 2002, and -27.6% back in 1974.
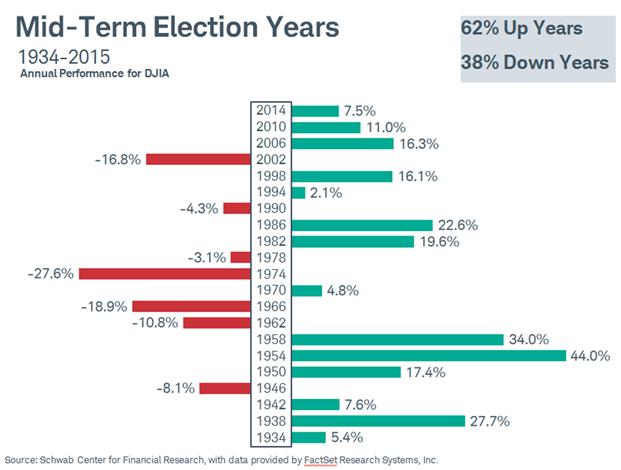
Figure 3
Pre-Election Years
The Pre-Election year is historically the strongest year of the election cycle.. (Figure 4). Since 1933, the stock market has shown a gain during the Pre-Election year nineteen out of twenty-one years (91%). The average annual percentage gain and the median annual gain (+16.1% and +15.8%, respectively) are well above the average annual gain of roughly +9%. In addition, during Pre-Election years the Dow Jones Industrials Average has posted a gain of +10% or more thirteen times, without a single double digit loss.
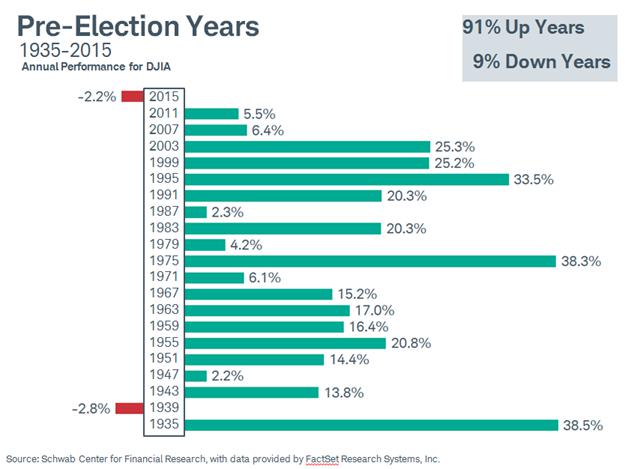
Figure 4.
Election years
The good news regarding Election Years in the stock market is that the Dow Jones Industrials Average has registered a full year gain 70% and the time, and regardless of which party is wins, the last seven months of Presidential Election year has been up 87% of the time (fourteen out of sixtten) since 1950. (Figure 5). The only two losing seven month periods were in 2000 when the presidency was still in doubt thirty-six days after election day, and in 2008 during the financial crisis.
The bad news is that there have been enough subpar years – most notably a 12% decline in 1940 when World War II loomed, and the massive -33.8% decline in 2008 that the average annual percentage gain and the median annual gain (+4.9% and +5.8%, respectively) are well below the average annual gain of roughly +9%. Also, looking back to 1896, election years have been weaker when they occur at the end of a president’s second term, as well be the case in 2016.
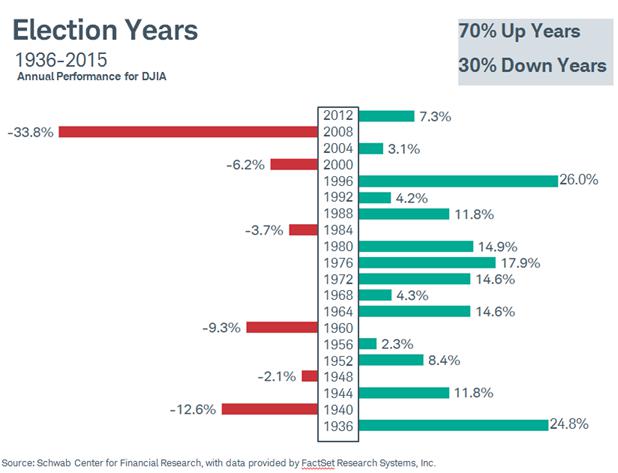
Figure 5.
Political Considerations
So, does it matter who wins the White House? History shows that the market fairs a bit better under Democratic presidents than Republican presidents, though some authors feel the difference is not statistically significant. But traders also have to look at the political alignment between the White House and the congress. The best combination for the market seems to be a Democratic president and Republican control of both the House and Senate, while the worst is a Republican President and Democratic control of both houses.
In Summary
As with all seasonal trends there are, of course, no “sure things.” One need look no further than the current election cycle to see that no system is always right. The historically weak Post-election year (2013) has actually been the strongest so far (up 26%) while the normally strongest Pre-election year(2015) has been the weakest (up 2.2%).
Lee Bohl can be contacted at Charles Schwab UK Ltd
Many market analysts have noted a general tendency for the stock market to experience a meaningful price bottom roughly every four years. Of course, the exact timing from low to low does not always correspond to an exact four year cycle. Still, there does appear to be some correlation between the action of the stock market and the four year period that extends from one presidential election to the next. This is most commonly referred to as the “Election Cycle.”
The Election Cycle
The “Election Cycle” as generally defined, consists of the Post-Election, Mid-Term, Pre-Election and Election years.
- The post-election year is the year when the new, or returning, President is inaugurated.
- Following the President’s first year in office comes the” Midterm year.” In this second year, congressional elections take place, bringing with them the potential to shift the political makeup and the legislative/executive branch dynamic.
- The third year of the cycle is the pre-election year – this is the year candidates begin launching their campaigns and engaging in political debates
- Finally, there is the election year during in which primaries are held nominee debates take place, culminating in the general election in November.
Figure 1 shows that there seem to be some meaningful differences in both rates of return and winning percentages in each of the election cycle years. The first two years the of the cycle tend to be weaker than the last two, with the post- election year being the weakest year and the pre-election year the strongest.

Figure 1.
A year-by-year analysis can provide further insights.
Post-election year
The post-election year has historically been the weakest of the four in terms of winning percentage, and the second worse in terms of net annual gain. Some analysts attribute this to the president tackling the most painful economic initiatives early in his or her term so that times are better when the next election rolls around. It is interesting that many major bear markets have started in the post-election year, specifically in 1929, 1937, 1957, 1969, 1973 and 1981. Also, some major wars have started in the post- election year as well: 1861 (the beginning of theU.S.Civil war), 1917 (U.S.entry into WWI), 1941(U.S entry into WWII) and 1965 (Vietnam War).
Examining Figure 2, we can see that stock market performance during Post-Election years can best be described as “all or nothing.” To put it another way, whichever way the market moves, it tends to move in a meaningful way. While Post-Election years have a mixed record of up vs. down years (48/52) what is interesting is that all of the “up” years generated a double digit gain, and six of the ten “down” years generated a double digit decline.

Figure 2.
Mid-term election year:
Mid-term election years tend to have a higher winning percentage (62/38) than post-election years. The average rate of return is higher as well, although the average and median annual returns (+7.0% and +6.2%, respectively) are both below the long-term annual average of roughly +9%. Also, much like the Post-Election year, the Mid-Term Election year tends to experience large price movements. The annual Mid-Term year has posted a gain of +10% or more nine times and a loss of -10% or more four times. (Figure 3). It is also worth noting that, even though the mid-term year has only been down 38% of the time since 1933, some of the losses were quite substantial, including -16.8% in 2002, and -27.6% back in 1974.

Figure 3
Pre-Election Years
The Pre-Election year is historically the strongest year of the election cycle.. (Figure 4). Since 1933, the stock market has shown a gain during the Pre-Election year nineteen out of twenty-one years (91%). The average annual percentage gain and the median annual gain (+16.1% and +15.8%, respectively) are well above the average annual gain of roughly +9%. In addition, during Pre-Election years the Dow Jones Industrials Average has posted a gain of +10% or more thirteen times, without a single double digit loss.

Figure 4.
Election years
The good news regarding Election Years in the stock market is that the Dow Jones Industrials Average has registered a full year gain 70% and the time, and regardless of which party is wins, the last seven months of Presidential Election year has been up 87% of the time (fourteen out of sixtten) since 1950. (Figure 5). The only two losing seven month periods were in 2000 when the presidency was still in doubt thirty-six days after election day, and in 2008 during the financial crisis.
The bad news is that there have been enough subpar years – most notably a 12% decline in 1940 when World War II loomed, and the massive -33.8% decline in 2008 that the average annual percentage gain and the median annual gain (+4.9% and +5.8%, respectively) are well below the average annual gain of roughly +9%. Also, looking back to 1896, election years have been weaker when they occur at the end of a president’s second term, as well be the case in 2016.

Figure 5.
Political Considerations
So, does it matter who wins the White House? History shows that the market fairs a bit better under Democratic presidents than Republican presidents, though some authors feel the difference is not statistically significant. But traders also have to look at the political alignment between the White House and the congress. The best combination for the market seems to be a Democratic president and Republican control of both the House and Senate, while the worst is a Republican President and Democratic control of both houses.
In Summary
As with all seasonal trends there are, of course, no “sure things.” One need look no further than the current election cycle to see that no system is always right. The historically weak Post-election year (2013) has actually been the strongest so far (up 26%) while the normally strongest Pre-election year(2015) has been the weakest (up 2.2%).
Lee Bohl can be contacted at Charles Schwab UK Ltd
Last edited by a moderator:
