Trading the NQ

The chief drivers of the "Trump Rally" have been the prospect of tax cuts and deregulation. If traders are disappointed in the progress toward either of these goals, there's no reason for anybody to buy, or at least buy further, particularly given that valuations are so high. Not that anyone needs to know any of this in order to trade the SLA. But it does provide context, and it does alert the trader to be on the lookout for signs of failure. We barely exited the trend channel and are now well back into it and at the moment are below the last swing low.
 
NQ
W: Price around OB

D: DL break. Price heading towards potential R of TR. The last attempt above this TR top didn't go well as the continuation failed due to demand pulling out at previous swing high dropping the price down and back into the TR. Now it's in RET mode. There are two modes to consider. Using SLA price is retracing after break of the demand line, and there's also the horizontal AMT at play at the top of TR. Usually a combination of these two and at a weekly overbought area is reason enough to limit snoozing to minimal.

H: Price heading towards the TR top.

attachment.php


attachment.php


attachment.php


Gringo
 

Attachments

  • Weekly.png
    Weekly.png
    53.5 KB · Views: 2,297
  • Daily.png
    Daily.png
    58 KB · Views: 2,319
  • Hourly.png
    Hourly.png
    33.2 KB · Views: 2,336
Last edited:
D: DL break.

Actually you've had three DL breaks, the first two of which would have been stopped out. Therefore, you'll benefit by deciding which DLs are going to be important enough for you to use as trade triggers. You may have an easier time of this by eliminating all those lines except perhaps for the DLs.
 
Actually you've had three DL breaks, the first two of which would have been stopped out. Therefore, you'll benefit by deciding which DLs are going to be important enough for you to use as trade triggers. You may have an easier time of this by eliminating all those lines except perhaps for the DLs.

...which leads me to this situation- if one tightened up their daily DL because price has started ascending at a steeper rate, we would now have 2 DLs and a decision to make. At the break of the tighter DL, do we take the short (after RET) knowing there is the original DL is looming, do we defer to the original DL for our next move ....OR (my guess) do we assume the original DL will be resistance and only take the short if the margin is wide enough?
 
It is assumed that the trader draws the tighter DL because he intends to trade it. Otherwise, there's no point in drawing it. If he instead plans to wait for a break of the previous DL, then whatever questions there may be about the tighter DL aren't pertinent. The trader might also have decided that he will wait for a break of the last swing low, but doing so means taking additional price risk since price will by then be lower than it would have been at the first entry.

Clearly the SLA trader has to do a little self-examination, at the very least what do I want and what am I willing to do to get it?
 
The clean version. We almost had a daily short but a no-go.

attachment.php
 

Attachments

  • tvc_bc170ae687d828d35552f2173b3f36a5.png
    tvc_bc170ae687d828d35552f2173b3f36a5.png
    34.5 KB · Views: 2,377
The clean version. We almost had a daily short but a no-go.

The dark blue lines aren't necessary unless you're waiting for a RET confirmation before going long. There are obvious advantages to waiting for this confirmation, but of course doing so places one even farther away from the DP. Again, what do I want and what am I willing to do to get it?
 
2 cents.

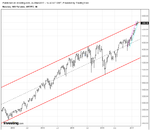
FWIW I'm not so much an interday trader, but I still keep tabs on what is happening on the higher time frames as part of planning my day ahead (slightly different daily than whats been posted).

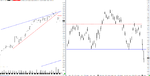
As far as the DL's go, a tighter DL at a known trading opportunity (the UL of the trending range) would give a trader an early entry as one would want to get in as close as possible to the upper limit, but, at a time where the behaviour has changed enough to suggest a move away is the most probable scenario.
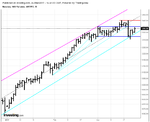
The 
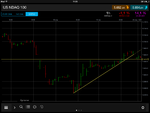
blue DL on the daily has been broken by Tuesdays drop, this drop was halted at the red DL price is currently retracing and a short is on the cards, if one waits for the red DL to break and ret if it rets at all, price will be getting further and further from the UL, the risk is going up and the reward is going down. If the trade does not work it doesn't work, the trader should have controls in place to keep losses small.

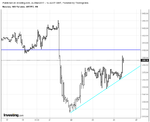
Price has been sitting around the MP of the drop and the move above has not been sustained, possible indication of future weakness as the weekly and daily LOLR assert themselves.

Take the opportunities as they present themselves and control the risk, sometimes easier said than done.
nq24032017daily.png
nq240320172000v.png
 
Don't place too much importance on "halting" at the DL, or any other line. Every service that provides charts compiles the data a bit differently, particularly when it comes to the adjustments required by rollovers. Some charts, therefore, will show your low nowhere near the DL. Others will show it bouncing off to the tick. But, in the end, nobody cares about the DL one has drawn. It's purpose is to show changes in demand and in the demand/supply balance. And that's all. Don't ask it to write checks it can't cash. What you've pointed out regarding the 50% level is probably more important than anything else going on at the moment.
 
Demand's already slipping on Sunday. The ETF'ers will have to wait for the morning.
 
It'll be interesting to see how this plays out, if the ret confirms one can draw a supply line to track the move. Depending on how one enters, the short would likely be triggered on the daily, the lower time frame has seen a breakout and retest of a level that has supported price over the last couple of trading sessions so might have given a more precise entry.

As Gring0 suggests, if one is not trading an instrument that is active at this time there is not a lot one can do except wait.
 

Attachments

  • nq27032017dailynotes.png
    nq27032017dailynotes.png
    68.3 KB · Views: 596
Pretty solid rebound. Price didn't budge much going upwards. The plot thickens.
 
The price was moving sideways for a bit. Demand has reasserted itself after that rest. On the weekly price is still around the overbought area (and can remain overbought as long as demand is there). Since the new high in place I have drawn a newer demand line that is more in tune with the stride of the price in my opinion (It may have been Db's opinion but it's getting harder to tell the difference anymore).

attachment.php


attachment.php


Gringo

Edit: The red weekly lines lines aren't porting over for some reason so I have just left them to our imagination to realize where price is in relation to the weekly channel.
 

Attachments

  • NQ Weekly.png
    NQ Weekly.png
    37.1 KB · Views: 2,603
  • NQ Daily.png
    NQ Daily.png
    26.8 KB · Views: 2,587
NQ Daily Ret

NQ Daily: DL break + RET


Gringo
 

Attachments

  • NQ Daily.png
    NQ Daily.png
    30.2 KB · Views: 256
Last edited:
Hello Gringo, I am also looking for this short NQ and was wondering how do you define a successful retracement? At what point do you consider price is giving you a heads up and you are good to enter your order?

My definition is on the hourly, I wait for a break of the DL/SL plus a LH/LL and then I enter a stop limit order below the most recent low, waiting for price to propel my entry in the right direction.

For instance, right now I am seeing a break of the hourly dl on the Nq and potentially a lower high so I will enter short if price makes a new low below the horizontal line on my chart.

Is this the sort of thing you look at? Some times I wonder whether this is a premature entry or I should add more variables to the setup.


Cheers!
 

Attachments

  • image.png
    image.png
    72.8 KB · Views: 273
Hello Gringo, I am also looking for this short NQ and was wondering how do you define a successful retracement? At what point do you consider price is giving you a heads up and you are good to enter your order?

My definition is on the hourly, I wait for a break of the DL/SL plus a LH/LL and then I enter a stop limit order below the most recent low, waiting for price to propel my entry in the right direction.

For instance, right now I am seeing a break of the hourly dl on the Nq and potentially a lower high so I will enter short if price makes a new low below the horizontal line on my chart.

Is this the sort of thing you look at? Some times I wonder whether this is a premature entry or I should add more variables to the setup.

Cheers!

Did you have an entry at the swing low and an exit today?
 
Did you have an entry at the swing low and an exit today?

Yes, entry triggered and price shoots up hitting my stop loss. It makes me think that I am entering too prematurely, or just say the hell with it and stop trading against the weekly trend (I.e. Stop shorting the nq)

Did you also go short yesterday or do you wait for more confirmation to for a succesful RET?
 
Last edited:
Yes, entry triggered and price shoots up hitting my stop loss. It makes me think that I am entering too prematurely, or just say the hell with it and stop trading against the weekly trend (I.e. Stop shorting the nq)

Did you also go short yesterday or do you wait for more confirmation to for a succesful RET?

Started a new trading journal devoted to trading NQ, I welcome your input.
 
So price inches ever closer to the upper limit of the weekly trend channel. Shall we get there today?
 
Top