You are using an out of date browser. It may not display this or other websites correctly.
You should upgrade or use an alternative browser.
You should upgrade or use an alternative browser.
leovirgo
Senior member
- Messages
- 3,161
- Likes
- 156
Hi Leovirgo,
I've never been convinced of the merit of looking at market breadth / internals and have taken the view previously that they're more likely to muddy the waters than they are to clear them. However, I have to say that the chart attached to your last post is very clear and simple (the way I like it), so perhaps I need to revisit the idea! Two questions if I may:
1. Sometimes it's necessary to cherry pick a chart to illustrate the point one wants to make when posting on a forum such as this. (I do it all the time!) Would I be right in thinking that most days it isn't anything like as clear cut as your example with the oscillator, breadth and internals all lining up neatly? I'm just trying to gauge how typical the chart is and the level of skill required to interpret it.
2. Like you, most forum members seem to use Tradestation and I'm with eSignal. Do you know (or does anyone else know) if and how I can set up a similar chart in eSignal?
Cheers,
Tim.
Hi Tim,
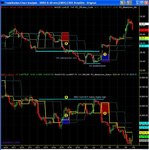
You are quite right in saying that it is not always as clear cut as demonstrated in my posts. However, if you have another benchmark such as Support/Resistance line and price action based on Market internals, then it is not that difficult to interpret them. Please see today's chart. MB and NetVol were bullish/positive and yet long entries at blue dots didn't go very far. The first one is a loss but the rest are sort of okay. As for the set up, $ADD is market breadth.
cheers,..
Attachments

leovirgo
Senior member
- Messages
- 3,161
- Likes
- 156
Leovirgo,
Could you clarify what you are plotting:
1. Market Breadth - Is this advancing - declining issues
2. Market_Internals ?
Thanks
Hi DCraig
$ADD is market breadth. Market internals is custom indicator. cheers,..
Hi DCraig
$ADD is market breadth. Market internals is custom indicator. cheers,..
Thanks, but just to clarify:
$ADD == adv issues - dec issues ?
leovirgo
Senior member
- Messages
- 3,161
- Likes
- 156
Thanks, but just to clarify:
$ADD == adv issues - dec issues ?
It is in deed.

leovirgo
Senior member
- Messages
- 3,161
- Likes
- 156
Please check the chart at my blog, which is SYSTEM APPROACH TO THE MARKETS
Please check the chart at my blog, which is SYSTEM APPROACH TO THE MARKETS
hello leo
thanks it is very interesting thread 👍
from some reason i couldn't find the indicator you are using in tradestation list.
could you help me with this
elis58
leovirgo
Senior member
- Messages
- 3,161
- Likes
- 156
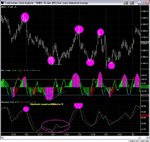
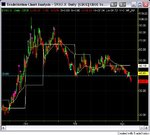
Trading 10minutes cycle withing 60minutes
Here I'd like to demonstrate a simple cycle trading entries. $INDU has been in a range for the last few days and it produced nice tradable cycles. Just take reversal trades based on 10minutes OB (overbought) while 60minutes cycle is also backing up in the same direction. For this chart, I have omitted Market Internals to make it simple and easy to see.
Here I'd like to demonstrate a simple cycle trading entries. $INDU has been in a range for the last few days and it produced nice tradable cycles. Just take reversal trades based on 10minutes OB (overbought) while 60minutes cycle is also backing up in the same direction. For this chart, I have omitted Market Internals to make it simple and easy to see.
Attachments
leovirgo
Senior member
- Messages
- 3,161
- Likes
- 156
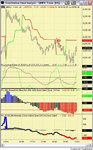
My previous post correctly called the bear market move down. Now this is another call for the so called bear market rally.
This is what I wrote in "Potential Setups" thread.http://www.trade2win.com/boards/general-trading-chat/32991-potential-setups-700.html?posted=1#post731874
Vix has fallen well below 38 which had been acting as a support on daily. That means equities "should" retest January mean which is 8470 on YM or 8500 on INDU cash. However, looking from the forex perspective, cable looks like it needs a breather. So, the downside for indices could be just temporary and equities may be looking alot higher in coming weeks. Let's see if I can buy the dips...
Attachments
Last edited:
leovirgo
Senior member
- Messages
- 3,161
- Likes
- 156
I haven't updated this journal for a while. Most of my recent works are here in vwap engine.
leovirgo
Senior member
- Messages
- 3,161
- Likes
- 156
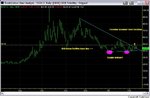
Vix has fallen well below 38 which had been acting as a support on daily. That means equities "should" retest January mean which is 8470 on YM or 8500 on INDU cash.
VIX has correctly called this rally, more than two weeks ago! Buy the dip for TA traders or buy and hold for retail investors would have worked perfectly.
🙂