jeadie1
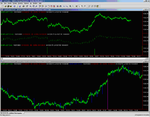
Sorry, I should have been clearer. If you add one of the built-in TS studies they tend to default to using the first data-stream on the chart. So, if you added an MA to either of the two charts I show above, the MA would use the 1 minute ES data, for that is the data I first added to both those charts. If I had added the daily data first, then the MA would have used that. Some studies allow you to override the data stream so you could choose the second or third data stream etc.
Second point is that you can choose where to display the output of a study, irrespective of which data stream the study uses. My first chart actually consisted of three subcharts, so I can choose which of the three subcharts to display the study on. So, for example, I could add an MA (which would use the first data stream, in this case the 1 min ES) and then choose to display the output from that study in any of the three sub-charts, or indeed in a separate fourth sub-chart by itself.
If you write your own studies you can synthesise indicators from multiple data streams/symbols, since all datastreams are accessible within EasyLanguage. There are certain restrictions in how data is presented to EasyLanguage when dealing with multiple, different time-frames of course, but you can see that TS is quite flexible.
Above comments apply to TS2000i. Don't know about TS7+, although from what I've read, it is the same (or even more flexible).
Paul


