time linked charts

jeadie1

Junior member
Messages
16
Likes
0
Hello,

Does anyone know which charting software can do the following:

With two chart windows open of say ES, with one set to 5 minute and one set to 1 minute. When I scroll back in time one one chart I want the other chart to automatically scroll back to the appropriate time.

Thanks
 
Last edited:
Hi Jeadie,

I think you may be asking a bit much, the idea of separate windows is that they remain separate!

Best of luck with your search.
 
Time Linked Charts

There are many programs that are like this, how ever I think that you should try http://www.neoticker.com and their demo yon can open two windows, they also link into data feeds from people like IB etc.

Another program is http://www.ensignsoftware.com. The feature you are looking for is called global crosshairs.

I hope that the helps.

Cheers Artful
 
Just to make sure we're talking about the same thing ...

In Qcharts, when you have two windows open and you move your cursor across the 1 minute chart will produce a vertical line which moves along the 5 minute chart in proportion to the move on the 1 minute chart.

Actually you can have 5 windows open and they will all do the same - it's one of those neat things which the program does, and you just get used to using it all the time.

It also works across different tickers - so for example if I move my cursor across a 5 minute ES chart, the line will also move across a 10 minute Dow chart, or whatever charts I want to.
 
Thanks for the help.

I previously had a look at the demo for both Qcharts and Ensign and I did not spot this feature !

I have had Sierra for the last year or so and am very pleased with it, save the lack of this particular feature.

Anyhow I will be going back to have a look at the demos of Qcharts and ensign.

Thanks
 
You can do what Skim has described in both eSignal and TradeStation. I don't believe you can scroll two windows at once though.
 
Skim,

To clarify I don't just want the cursor to move, but the actual chart as well.........so if I move back to 15:00 last monday on the 5 minute, the 1 minute chart will move to the approprate position as well.

Thanks
 
No, that's not possible - the cursor moves across both charts, but you use a different feature to move the actual charts themselves and this means you can't move both.

Looks like TBS was right! teehee :D
 
In Tradestation you can put 2 different time frame charts in 1 window as shown in the attachment and yes they do move together when you scroll back or forwards.


Paul
 

Attachments

  • icos.png
    icos.png
    10 KB · Views: 352
Here's an example of TS2000i showing multiple time-frames for ES (1 min, 15 min and daily). The upper display shows the charts in three separate sub-charts, while the lower chart has them all overlaid on the same chart.

Can be very useful, although any studies, like MAs etc, will only work from the datastream that you first add to the chart, in the above example, the 1 minute ES datastream, which is a pain

Paul
 

Attachments

  • es3ts.png
    es3ts.png
    50.5 KB · Views: 328
Thanks for the tradestation info;

Paul you say that studies cannot be used on both charts, so I could not have an oscillator associated with each chart also scrolling back automatically ?

Thanks
 
Actually, in TradeStation (in 7.x, not sure about 2000i) you can also 'link' two charts and then when you click on a specific bar on one of the charts the other chart will also go to that time period. Not quite scrolling but it may do what you want.
 
jeadie1

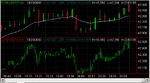
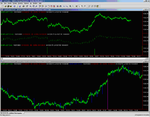
Sorry, I should have been clearer. If you add one of the built-in TS studies they tend to default to using the first data-stream on the chart. So, if you added an MA to either of the two charts I show above, the MA would use the 1 minute ES data, for that is the data I first added to both those charts. If I had added the daily data first, then the MA would have used that. Some studies allow you to override the data stream so you could choose the second or third data stream etc.

Second point is that you can choose where to display the output of a study, irrespective of which data stream the study uses. My first chart actually consisted of three subcharts, so I can choose which of the three subcharts to display the study on. So, for example, I could add an MA (which would use the first data stream, in this case the 1 min ES) and then choose to display the output from that study in any of the three sub-charts, or indeed in a separate fourth sub-chart by itself.

If you write your own studies you can synthesise indicators from multiple data streams/symbols, since all datastreams are accessible within EasyLanguage. There are certain restrictions in how data is presented to EasyLanguage when dealing with multiple, different time-frames of course, but you can see that TS is quite flexible.

Above comments apply to TS2000i. Don't know about TS7+, although from what I've read, it is the same (or even more flexible).

Paul
 
Top