Exactly m8.
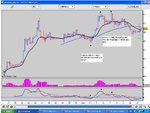
Start having a look for it at high and low points on different times scales. It is present on all.
You are looking for the price to be making new highs while the indicator is sloping down making new lows. Outcome. Price drops.
Making new lows while indicator makes new highs. Outcome. Price rises
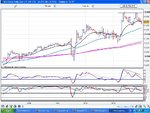
Start having a look for it at high and low points on different times scales. It is present on all.
You are looking for the price to be making new highs while the indicator is sloping down making new lows. Outcome. Price drops.
Making new lows while indicator makes new highs. Outcome. Price rises