Hi all,
I would like to have your opinion on the following strategy
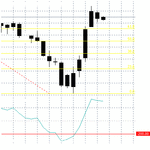
FTSE Index Rolling Daily
15 min chart
MACD set at 12/26/9
Parabolic SAR NORMAL SETTING
MA 14 period
1. When SAR Turns Green (alert is set), if MACD is Green and also MA is Green go LONG
2. When SAR Turns Red (alert is set), if MACD is Red and also MA is Red go SHORT
STOPS
Check distance from Bollinger Line
Range: 10-20 points
Thanks in advance
I would like to have your opinion on the following strategy
FTSE Index Rolling Daily
15 min chart
MACD set at 12/26/9
Parabolic SAR NORMAL SETTING
MA 14 period
1. When SAR Turns Green (alert is set), if MACD is Green and also MA is Green go LONG
2. When SAR Turns Red (alert is set), if MACD is Red and also MA is Red go SHORT
STOPS
Check distance from Bollinger Line
Range: 10-20 points
Thanks in advance