Trading Strategy - 15 min Chart

gbifulco

Newbie
Messages
4
Likes
0
Hi all,

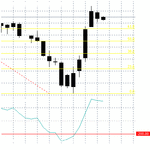
I would like to have your opinion on the following strategy

FTSE Index Rolling Daily
15 min chart
MACD set at 12/26/9
Parabolic SAR NORMAL SETTING
MA 14 period
1. When SAR Turns Green (alert is set), if MACD is Green and also MA is Green go LONG
2. When SAR Turns Red (alert is set), if MACD is Red and also MA is Red go SHORT

STOPS
Check distance from Bollinger Line
Range: 10-20 points

Thanks in advance
 
Black Swan

This one is from UK
 

Attachments

  • black swan.gif
    black swan.gif
    5.1 KB · Views: 1,377
Are you scalping? If so then the FTSE isn't liquid enough, try the dax or better still the e mini s&p.
Also, your indicators are lagging (imho). Use price action and volume. Try market profile, TIme & Sales, trin and tick.

Good Trading.
 
Seems ok

Hi all,

I would like to have your opinion on the following strategy

FTSE Index Rolling Daily
15 min chart
MACD set at 12/26/9
Parabolic SAR NORMAL SETTING
MA 14 period
1. When SAR Turns Green (alert is set), if MACD is Green and also MA is Green go LONG
2. When SAR Turns Red (alert is set), if MACD is Red and also MA is Red go SHORT

STOPS
Check distance from Bollinger Line
Range: 10-20 points

Thanks in advance
Seems ok, perhaps also look to MACD 5min chart crosses for confirmation too ?
So lets say you get a MACD Greenon your 15min charts, but MACD 5min chart is already high above the zero line and has a huge gap between the faster line and the slower line, then it may not be a good entry to go long since 5min chart is showing overbought. Perhaps better if the MACD goes green on your 15min charts and then 5min MACD is below the zero line and faster line is starting to cross the slower line for confirmation
Anyhow if it's working don't change it
Happy trading.
 
Top