Simple ADX Strategy
I have called this strategy: Simple ADX. It is my intention to provide the code for a basic trading strategy with the intention to learn from the input from other traders using this forum.
The basics of the strategy are as follows:
When the 14 period ADA rises from below 15 to above 15 with a change in the ADX of 0.5 or more, a big trend might be underway.
A simple Parabolic Stop is used.
Let's look at the code as I use it in Genesis Trade Navigator:
For a Long Entry:
IF DMI plus (14 , 0) > DMI minus (14 , 0) And ADX (14 , 0) <= 15 And ADX (14 , 0) > ADX (14 , 0).1 And Next Bar DayOfWeek <> 3 And Next Bar WeekOfMonth <> 4
For Long Exit:
IF Crosses Below (Low , Parabolic (0 , 0.02 , 0.2))
Then Sell Market
For Short Entry:
IF DMI minus (14 , 0) > DMI plus (14 , 0) And ADX (14 , 0) <= 15 And ADX (14 , 0) > (ADX (14 , 0)).1 And Next Bar DayOfWeek <> 2
For Short Exit:
IF Crosses Above (High , Parabolic (0 , 0.02 , 0.2))
Then Sell Market
The Long Entry looks at a DMI Plus > DMI Minus and the ADX must be rising ADX > ADX.1 (= one bar ago)
The last two conditions were added after back testing: it should not be the 3rd day of the week; it should not be the 4th week of the month.
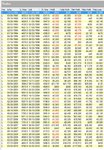
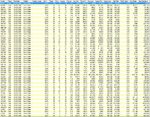
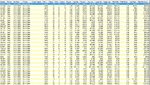
I tested it on the Japanese Yen (in Genesis G6J-067).
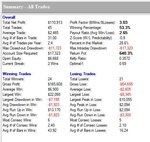
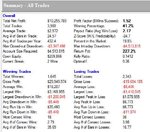
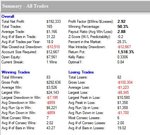
Looking at the results over a long period of time (1977 – 2009):
Total Net profit: $102.538
Profit Factor: 3.05
Winning Percentage: 51.8%
Return %: 966.7%
Average trade: $932
Max Closed-out drawdown: -$6400
Max IntraDay Drawdown: -$7908
Percent in the market: 18.9%
Total trades: 110
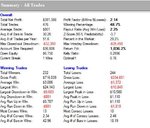
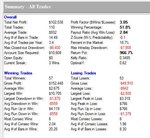
Looking at a time when electronic trading was more common (2001 – 2009):
Total Net profit: $24.903
Profit Factor: 3.43
Winning Percentage: 57.1%
Return %: 290.7%
Average trade: $889
Max Closed-out drawdown: -$ 5145
Max IntraDay Drawdown: -$ 5865
Percent in the market: 14.6 %
Total trades: 28
What I like about this system is the low drawdown. It does not trade often but it has been a consistent winner with an average profit per trade around $ 900.
Money Management has not been applied. For slippage and commission I used $ 45 per trade.
So, now it is time to start shooting holes in this system and improve it. It would be great to make this into a robust trading system applicable to more Commodities than just the Japanese Yen. By the way, it also show promising results on the DAX.
One of the improvements could be on the Stops and/or Exits being used.
I am very interested to hear constructive input and/or improvements.
Trader J
I have called this strategy: Simple ADX. It is my intention to provide the code for a basic trading strategy with the intention to learn from the input from other traders using this forum.
The basics of the strategy are as follows:
When the 14 period ADA rises from below 15 to above 15 with a change in the ADX of 0.5 or more, a big trend might be underway.
A simple Parabolic Stop is used.
Let's look at the code as I use it in Genesis Trade Navigator:
For a Long Entry:
IF DMI plus (14 , 0) > DMI minus (14 , 0) And ADX (14 , 0) <= 15 And ADX (14 , 0) > ADX (14 , 0).1 And Next Bar DayOfWeek <> 3 And Next Bar WeekOfMonth <> 4
For Long Exit:
IF Crosses Below (Low , Parabolic (0 , 0.02 , 0.2))
Then Sell Market
For Short Entry:
IF DMI minus (14 , 0) > DMI plus (14 , 0) And ADX (14 , 0) <= 15 And ADX (14 , 0) > (ADX (14 , 0)).1 And Next Bar DayOfWeek <> 2
For Short Exit:
IF Crosses Above (High , Parabolic (0 , 0.02 , 0.2))
Then Sell Market
The Long Entry looks at a DMI Plus > DMI Minus and the ADX must be rising ADX > ADX.1 (= one bar ago)
The last two conditions were added after back testing: it should not be the 3rd day of the week; it should not be the 4th week of the month.
I tested it on the Japanese Yen (in Genesis G6J-067).
Looking at the results over a long period of time (1977 – 2009):
Total Net profit: $102.538
Profit Factor: 3.05
Winning Percentage: 51.8%
Return %: 966.7%
Average trade: $932
Max Closed-out drawdown: -$6400
Max IntraDay Drawdown: -$7908
Percent in the market: 18.9%
Total trades: 110
Looking at a time when electronic trading was more common (2001 – 2009):
Total Net profit: $24.903
Profit Factor: 3.43
Winning Percentage: 57.1%
Return %: 290.7%
Average trade: $889
Max Closed-out drawdown: -$ 5145
Max IntraDay Drawdown: -$ 5865
Percent in the market: 14.6 %
Total trades: 28
What I like about this system is the low drawdown. It does not trade often but it has been a consistent winner with an average profit per trade around $ 900.
Money Management has not been applied. For slippage and commission I used $ 45 per trade.
So, now it is time to start shooting holes in this system and improve it. It would be great to make this into a robust trading system applicable to more Commodities than just the Japanese Yen. By the way, it also show promising results on the DAX.
One of the improvements could be on the Stops and/or Exits being used.
I am very interested to hear constructive input and/or improvements.
Trader J
Attachments
Last edited: