DMI Indicator

bigtimetrader,

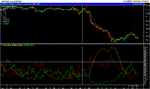
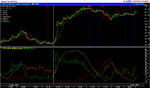
Thanks for the screenshot which is fine as all I wanted to do was see if the three lines matched how mine look on TS2000 which they do. I fully understand that you cannot take a shot when you get a signal for a trade so no problem. In the shot you have given do you enter the trade as soon as the ADX moves above the other two lines or wait until it has moved some distance above ?


Paul
 
gbr128 said:
Why in the world have you got +DI in red and -DI in green? Confused the life out of me for a while there....

I would have thought +DI in blue and -DI in red would make more sense.... ?

The color of the line is not really relevant, you can make it whatever color you want. The reason I do it this way is it makes sense to me:
green line on bottom = buy
red line on bottom = sell

It's the bottom and top lines that are what matters. Always white (DX) on top and whatever the bottom line is makes the call buy or sell. I just especially like red=sell that makes sense to my brain.

I enter when white breaks above the other 2 lines. Because many of my intra-day trades are in the .02 - .04 range. I want to be in right as it breaks above in case it back tracks quickly I can still take a small profit.
 
Just wondering if any of you have tried the strategy either for real or in the DAS software's simulator. I have been doing very well the past few days.
 
I am hoping to test it out over the next week to 10 days but I have my own trading style and this is something very different. I am always open to new possibilities in trading and I am looking forward to spending a day just looking at this.


Paul
 
bigtimetrader,

Once you are in a trade, how do you decide when to exit ?


Paul
 
Trader333 said:
Once you are in a trade, how do you decide when to exit ?

I look at the Nasdaq futures as a leading indicator and when the DX (white) line to breaks to the downside on the stock's chart, I usually bail out. There is however, some of what I would call "feel" in exiting, including a look at overall market conditions (mostly from the Nasdaq futures) and the stocks current trading pattern (down or up).
 
DMI Indicator, how to get started

DaveJB said:
So what does a falling DX (ADX?) mean?


Hi guys,

I’ve just started looking into trading and this thread has interested me loads...
What would be the best way for me to start learning how to trade? Which books and so on.

Any help would be great.

Thanks.
Suzi...
 
Suzisue said:
I’ve just started looking into trading and this thread has interested me loads...
What would be the best way for me to start learning how to trade? Which books and so on.

Any help would be great.
QUOTE]

Hi,
If you want to try this method, check out the website www.realfasttrader.com and try the free simulator. It lets you test a level 2 trading platform in real-time for 1 week. It will give you an idea of what it's like to trade (although it's a little different when its real).

Good luck :cool:
 
I asked, because I get the feeling that the underlying price action causing these indicator lines is not actually understood and I think it's a bad idea to trade using indicators if you don't know how they are constructed - it leaves you wide open to losses when a glance at the barchart tells you the indicator will be unreliable.
ADX is a bit of a pig to program, in my view, you build up a series of steps using the plus minus DI, DM, moving averages of these, and end up with an ADX... you can use the plus minus DM values to decide if the trade is long or short, the ADX itself is an indicator used to determine whether a trend exists - a falling ADX should indicate a trend running out of steam for example, but 'the' value at which a trend is present is one of those 'how long is a piece of string' affairs. If you are going to bail on a falling ADX (I assume this is the 'DX' of Bigtimetrader's post) then the falling ADX should be signalling a weakening trend, I'd have thought watching the actual price bars was a better guide at that point.
I'm not having a pop here, I'm really trying to ensure nobody thinks this is a black box system for making money and that readers are aware that DI/DM/ADX all stem from the same calculations - ie you are looking at the same thing from different angles, this isn't a case of having 2 or 3 different indicators that agree and signal a good trade. From previous experience a lot of people reading this will not appreciate that point, and will think that they're getting multiple 'buy' signals (for example) when it's really pretty much one indicator they're looking at... and to be honest I'd not trade on ADX alone!
Dave
 
It will be, as it's based on averages - obviously I'm from an EoD arena where the 'default' is 14 days... I imagine this is why BTT is using the future to run the ADX on - I might have misunderstood, but I assumed you'd run the ADX on the future (so you'd be taking a 'lagging' look at a prediction <g>) whilst trading the 'here and now' so to speak... the ADX on the future would tell you the 'expected trend' you might say, while the ADX lag just meant you got the timing nicely right for the non-future itrm being traded. Which is also why I figure you'd be better off watching the actual price chart for the moment to enter/exit - your ADX system tells you what you expect to happen, you then wait for price to confirm it before actually moving.
 
Here are a couple of recent examples, which I think illustrate the “mechanics” of DMI quite well.

ADX (yellow) shows the strength of the trend and so the higher the line the stronger the trend. The +DI (green) and –DI (red) shows the direction of the trend. Basically, buy signals are generated when +DI (green) goes above –DI (red) and conversely, sell signals are generated when –DI (red) goes above +DI (green).

The height of the ADX (yellow) line shows the strength of directional movement in the prevailing direction, which can be either up or down. If the ADX falls below the +D and –D lines, then the trend is flat and neither up nor down.

The colour codes are simply how I’ve set them up.

HTH

Cheers

Mayfly
 

Attachments

  • GBP_USD Spot.png
    GBP_USD Spot.png
    33.1 KB · Views: 950
  • Yahoo! Inc.png
    Yahoo! Inc.png
    31.8 KB · Views: 979
Yep,
what I'm querying is the way people are using the crossing of + or - DI by ADX to make the signal, when what you've basically got in the ADX is an EMA of the change in DI.. there are a whole series of EMAs going into each step of these indicators - and what it all boils down to is EMA'ing running totals from higher highs and lower lows... a falling ADX in itself signals a trend strength reduction, therefore I contend that the exit for a long trade should be 'the ADX is falling, indicating the uptrend is dying, plus the price has dropped by X from the high' or there's an engulfing pattern, or something to suggest that the signal is correct to call the top.
I don't see why confirmation would be taken to be 'indicator line A' crossing 'indicator line B' when indicator A is actually derived from indicator B - it makes more sense to confirm by an independent source where possible. A lot of readers would see these posts as offering a decent trading system, and I'm not decrying it for one moment, but many readers would quite likely be unaware that the different lines all originate from the same info - difference in highs, difference in lows - I am therefore suggesting that it might be a good idea to confirm via a second indicator that is not derived from the high1-high2 etc, or by visual confirmation from the price chart itself... if you are trading an uptrend, and this indicator says 'trend is ending' then I'd have thought it was a fairly simple matter to check the bar/candle chart and decide for yourself if that signal was good... or at least a distinct possibility.
Dave
 
DaveJB said:
Yep,
I am therefore suggesting that it might be a good idea to confirm via a second indicator that is not derived from the high1-high2 etc, or by visual confirmation from the price chart itself... if you are trading an uptrend, and this indicator says 'trend is ending' then I'd have thought it was a fairly simple matter to check the bar/candle chart and decide for yourself if that signal was good... or at least a distinct possibility.
Dave
This is definitely right; confirmation of a trade decision should come from some other factor than the ADX crossover (the 3 line ADX chart does contain definite repetiition). And I have also always wondered why lagging indicators, such as any kind of moving average, can be taken as confirmation of something (eg the current trend) that is more up to date in the price chart itself. Trends either are or are not continuing at a given moment; they do not get confirmed by calculations out of prior data points.

Having said which, the fact that the ADX is falling, or that the +DI has started to fall, are quite good reminders to look straight at the evidence, when deciding whether to close a position. Because you cannot tell in advance when the line is going to reach a maximum (or a minimum, you cannot do the same thing when deciding whether to start a trade, as it is always too late. That is presumably why the +DI/-DI crossover signal was invented, despite the demonstrable fact that the timing is always off.

And, of course, I don't decry people's success in using this indicator to make money, though I suspect success shows more about them than about the indicator.
 
An excellent final point,
that you make money from the system suggests you're pretty good and giving the system more credit than you should for what is actually your own ability! I'd also like to stress that coming onto a board and offering an idea is in itself a character reference in my book - my comments are intended to be helpful, not critical!
 
DaveJB said:
An excellent final point,
that you make money from the system suggests you're pretty good and giving the system more credit than you should for what is actually your own ability! I'd also like to stress that coming onto a board and offering an idea is in itself a character reference in my book - my comments are intended to be helpful, not critical!

I don't mind critical comments as long as they are not unnecessarily negatively biased, which I do not believe yours are. You are just offering a differing opinion which can actually help a conversation or debate IMO. I do not propose this is a get rich quick or perfect system. Different things work for different people, I am just trying to share what works for me. However, I didn't just come by this. I have been trading this method for 2+years.

Now to address some of the comments that have been discussed:
Obviously the indicators within DMI/ADX are based off the same data it all makes up one indicator. Also I think that all indicators in theory are lagging, there is no price chart I know of that will tell you definitively what will happen next, they are all based on previous data. What we are trying to do in reading charts is move the odds into our favor as much as possible. There is definitely a price determination as well as a falling ADX in my exits, otherwise I would probably never be able to take the longer .10+ moves. ADX falling implies the "call" weakening. Futures falling (or rising in the case of a short, we can't forget shorts thats about 40% of my trades) when ADX is also falling is a good sign that the call is reversing and it is time to exit.

As I said I have been trading for 7+years and this method for the past 2+years. There will be a learning curve in any strategy. Nobody should expects to jump right in get the same results I am getting. I've been doing this a long time. I do suggest maybe you take a look, because this DMI/ADX indicator is the best ( and easiest) I have found and may it may help alot of people go to the "next level".
 
To add a little to the above, readers may be interested in the following from the Metastock manual.

It goes on to agree with crossing above/below and then follows:

"These simple trading rules are qualified with the 'extreme point rule'. This rule is designed to prevent whipsaws and reduce the number of trades.

The extreme point rule requires that on the day that the +DI and -DI cross, you note the 'extreme price'. If you are long, the extreme price is the low price on the day the lines cross. If you are short, the extreme price is the high price on the day the lines cross.

The extreme point is then used as a trigger point at which you should implement the trade. For example, after receiving a buy signal (the+DI rose above the -DI), you should then wait until the security's price rises above the extreme point (the high price on the day the the +DI and -DI lines crossed) before buying. If the price fails to rise above the extreme point, you should continue to hold your short position."

"Wilder's book suggests the system works best on securities that have a high Commodity Selection Index value. As a rule of thumb the system will be profitable on commodites that have and ADXR value above 25. When the ADXR drops below 20, then do not use a trend -following system"

This is not an indicator I use, so I have no personal experience to comment further as to the reliability or otherwise.

John
 
bigtimetrader,

What is the duration of a typical trade ? also what is the longest and shortest time you have been in a trade ?


Paul
 
Top