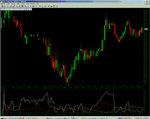
DMI Indicator

bigtimetrader

Junior member
Messages
47
Likes
2
I average between $500 - 1000 per day trading with the DMI/ADX (Directional Movement Index/ Average Directional Index) through the DAS PRO software.

DMI/ADX works for any trading style from day trading to swing or position trading. I combine the ADX/DMI onto one study. DMI is actually made up of 2 sub indexes the PDI (Plus Directional Index) and the MDI (Minus Directional Index). I make the ADX line white in color, the PDI line red, and the MDI line green. The DAS software makes it easy because it already combines ADX/DMI into one study. Although, I'm pretty sure most softwares out there also have DMI/ADX (it's very common), I think it's easiest to use and understand when they are combined on one study.

This is how I do it:
When white (ADX) crosses the other lines and is at the top and green (MDI) is at the bottom (red in the middle), it's a buy. White on top red (PDI) on the bottom (green in the middle), it's a sell. Often the simplest things work best and this seems simple and it is, but it works very good. I consistently make between .02 -.05 cents on 2000 - 5000 share trades. I usually go for more around the open (maybe .05-.10 or more). I ONLY trade widely traded Nasdaq stocks, like CSCO and INTC. I use 1 minute and 3 minute intraday charts to day trade. As I said it can also work for swing trading if you use a longer time frame chart.

You can try this theory out by going to the http://www.realfasttrader.com website and using their "free simulator", which lets you try the DAS PRO software free for a week. Test the DMI like I stated above, it has been working GREAT for me for several years now.

If you have any questions, post them and I will try to answer.
 
At 2 - 5 cents per 2000- 5000 is a bit poor....Others on here wouldn't bother to get out of bed for anything less than 75 cents... Have you tried using 20 MA/10 MA crossover? :cheesy:
 
ChartMan said:
At 2 - 5 cents per 2000- 5000 is a bit poor....Others on here wouldn't bother to get out of bed for anything less than 75 cents... Have you tried using 20 MA/10 MA crossover? :cheesy:

That comes across as a rather negative and condescending remark. I'm sure you make .75 on day trades everyday, right? :rolleyes:

Do the math, .02 - .05 is certainly not poor. We are talking about day trading here. You can generally do that 15-20 x a day with this strategy. Like I said I might take .10 (maybe more) around the open or close. Day trading has more to do with quantity of positive trades than quality (of large moves). Any positive day trade is good at 3000 or more shares... even .01

See if this would make enough sense to "get out of bed for".
Look at the low end as an example:
3000 shares x .02 = $60 (US)
$60 x 15 trades = $900 (conservatively would be at least $700 net after commission)

Lets say you do even worse than that, you average $500 net after commissions. $500 x 253 trading days a year = $126,500 a year (that's net after commissions). You can certainly do better, but remember this is a low end estimate and most people would be happy with even that much.

.75 is nice, but that will happen far more often swing trading than day trading. Unless you are playing very volatile stocks, which can be very dangerous as well. Since (depending on your source) upwards of 80% of day traders lose money, I think most people would be happy with $500 - 1000 a day in profit (believe me I have made considerable more on many occasions). Especially in stocks that are fairly stable like CSCO and INTC.

IMO, MA's don't hold a candle to DMI, not even close. I suggest you try it as I explained in my last post. After that you can come to your own conclusions about what works. I already know it works for me.
 
bigtimetrader,

How much do you pay in commission (full round trip) for each trade of say 3000 shares ?

Which broker do you use ?


Paul
 
neil said:
How does that compare to Interactive Brokers?

I have used IB (Interactive) in the past. IB has horrible customer service (often you will wait on hold 5-10 minutes and then getting a rude jerk when you get through) and I never particularly liked IB's software either.

Probably slightly more commission (maybe $1 each side) at Realfasttrader. Howver, customer service is good probably because they are actually traders themselves so they understand your problem. Plus the software is the only one that makes DMI indicator so easy to use and thats how I make my money. It's worth a slightly more for good support and software (IMO).
 
A few people have complained about IB being poor on customer support but I have not found that to be the case although I know many people dont like the TWS interface. Can I ask how long ago you last used IB ?

IB costs to trade 3000 would be more than the above at $17.50 per side (or $35 in total) which means that Realfasttrader are highly competitive in comparison and for this type of trading low transaction costs are essential


Paul
 
I last used IB around 2 years ago. The experience was so bad I would never use them again. (I've also used several others brokers including cybertrader and mbtrading)

RFT (Realfasttrader.com) has worked well for me for about 2 years now. I am ok with the commission, but I really like their DAS PRO software because of the DMI charting. I have done very good in my trading since switching to RFT.
 
Hi Big Time,

What length are you using on ADX/DMI etc. on 1 min.? Also - have you ever looked at this on NQ,ES etc?
 
Just to clarify the ADX line in the DAS PRO software is actually just a DX line, which is apparently slightly different (not exactly sure how, I am not a technical expert). I do not trade futures although I do use a Nasdaq futures chart as a leading indicator to help me with exit points.

I use 2 intraday charts with DMI a 1minute and a 2 minute. The 1 minute makes the initial call & the 2 minute confirms it. Some people that I know use a 3 minute to confirm instead of a 2 minute.
 
What time length are the indicators set to ? I believe that the default is 14 but you may have it set at a different length.


Paul
 
I am using a 15 smooth period currently. Although I have at different times had it set anywhere from 12 to 15.

PS: DMI made a few nice calls in CSCO today, from .05 - .10 (plus several smaller moves).
 
I have been looking at the DMI is Tradestation 2000i and it is setup the same as you have described in DAS PRO so includes the ADX. I will have a look at it during the next week. Do you also use Level II ?


Paul
 
ADX is constructed (eventually) from the plus/minus DM: a long under your system should be red over green, short is green over red, the white ought then to simply be at a level consistent with a trend being present - ie you are using positive and negative DM to indicate long/short as per normal, and you ought to find that it's the value of the ADX, rather than it's position relative to the other lines, that confirms the trade is worth taking. Conventionally you'd set a level for the ADX (20-30 maybe?) and the signal would be of the style 'red is above green, ADX is 30 and rising' to signal a long. The red and green relative to each other indicates direction (bull/bear) and the false signal problem is (hopefully) settled by the 'ADX over n and rising'.
Dave
 
bigtimetrader,

Is it possible that you could post a screenshot of a signal that you get just prior to placing a trade and this would be good to see ?


Paul
 
Trader333 said:
Is it possible that you could post a screenshot of a signal that you get just prior to placing a trade and this would be good to see ?

Sorry that is not practical. When a trade call happens I am busy trading it. I don't have time to stop and take screen shot until I'm out of the trade. You have to always concentrate on your position (especially with 3000 or more shares) from set-up, to entry, and through till you close it.

Here is an old screen shot I took from back on 2/26/04. I'll try to get a new one up later.
 

Attachments

  • 022604.gif
    022604.gif
    35 KB · Views: 1,399
Oh yeah, in that screen shot disregard the beginning where it shows the pre market quotes, because the strategy really only works during market hours.

Look at the call it made at about 10:45am on that day, when white line(DX) shot up, you probably could've made .20+ on that one. :cheesy:
 
Why in the world have you got +DI in red and -DI in green? Confused the life out of me for a while there....

I would have thought +DI in blue and -DI in red would make more sense.... ?
 
Top