The S&P Chronicles - An Amalagnation of Wyckoff, VSA and Price Action

@Peacefull Warrior

Hello,

Question regarding Shakeout and Absorption

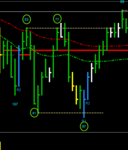
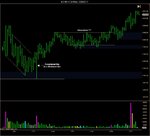
Last Friday i noticed what i think is a shakeout bar at 11:10 and went long on the pull back at 11:45 and then the market was up slightly and then kind of flattened out and i came out 2:40. Only after it pierced the top of the channel i figured out it might be an absorption. It dipped inside the channel (absorption ?) and goes for another 3 points.

If time permits, if can you talk about the following i would appreciate.
Are the bars in side the channel tight enough to be called an absorption ?
if absorption, do we have to anticipate absorption's following shakeout ?
what are classical signs of absorption ?

Thanks for very much your insights.
 

Attachments

  • Shakeout & Absorption.jpg
    Shakeout & Absorption.jpg
    86.2 KB · Views: 510
Last edited:
Great questions:

In Wyckoff we have a ''terminal shakeout'' that occurs at the end of accumulation, a trading range or into a support area. Or we have an ''ordinary shakeout'' that occurs in an uptrend. BOTH achieving the same result.

In my trading its the ordinary shakeouts that get all the attention, due to the fact that we can on occasion profit from them with a setup. An ordinary shakeout in an uptrend will get rid of weak holders, usually (but not always) the next 2 to 3 proceeding bars will eradicate all the selling and start trading above continuing with the uptrend. We get instant confirmation that it was an ordinary shakeout, this means the market has more to give to the upside, we look for reasons to apply bullish setups or trade the shakeout itself

Terminal shakeouts are a little more complex and will often need testing due to it's nature

In regards to the bar in question, its more of a spring as we dip under the previous swing low and reverse to close firm - importantly at 2461.50 is a major daily support level (we would expect demand to emerge)

The bar has shakeout characteristics, the spread itself is not that overt - as we have a few wide spread bars to the left (fairly close). The labels/names of a bar aren't important, its the action; how much does a bar in question accomplish?

The pullback you entered was testing the spring for supply and was a good entry; however as you mentioned the market stalled and went sideways for an hour or two - this was to be expected as we had known supply to the left. This area must be taken into account before the trade was placed and have a plan set out in advance covering all possibilities and how you would react this will ease any tension/anxiety that you may of had holding the trade. A good looking shakeout bar is the 16:00pm bar, contextually correct

As for absorption, it is a very lengthy subject, I could write pages on the matter. There are some editions of the Chronicles covering Absorption (the editions are labelled as such). I would suggest to study Wyckoffs original text on Absorbtion, a fantastic read/case study

Hope this helps,

F
 
ES 31st July 17

Wyckoff and VSA principles at play in today's action:

Distribution (5m) A core Wyckoff component
Hidden upthrust setup
Upside shakeouts
Shortening of the Thrust
Waves (setup)
Spring

PDF attached (4 pages)
 

Attachments

  • ES310717-1.pdf
    250 KB · Views: 474
ES 1st August 17

Wyckoff and VSA principles at play in today's action:

VSA - No demand (setup)
Spring (setup)
Effort vs Result (excellent example)
Bar by Bar analysis

PDF attached (3 pages)
 

Attachments

  • ES010817-1.pdf
    240.1 KB · Views: 473
Last edited:
From an aspiring trader of the same discipline looking to put in the work to get where you are - thank you for each and every post. There is a gold mine of knowledge in this thread, I will be catching up for quite some time.
 
Hello Sir, @Peacefull Warrior

When do you give importance to Wave count, be it either on a 5 min chart or on a tick chart?

Today you never mentioned the wave count; suppose for instant on the first trade, when you detected a no demand bar you went short - excellent. for me i'm looking at wave volume of 77 compared to previous volume of 53 and in my mind I'm thinking the current wave has more demand at the moment compared to the previous up wave and why take a short? (i know you gave a good compelling story on on why you took a short - is that strong enough to ignore the wave count?)

similarly on you second trade where you went long, i notice the spring in real time, (admit that i did not read the volume clearly as you mentioned as denoted 1,2,3,4 & 5) with a vol of 97 compared to a volume of 41 for the previous down wave - you may call this, twice the volume of previous down wave but still did not go lower and hence a good case for long.

Just curious to know the priority of importance one should you give to wave counts

If this question is stupid, please ignore. Just trying to learn.

N.
 

Attachments

  • wave count.PNG
    wave count.PNG
    15.3 KB · Views: 297
@novicetrader33

There are no stupid questions, it's important to be inquisitive:

With regards to wave volume remember that 1 wave combines a whole leg of information, sometimes when we dissect (for example bar by bar) we gain additional info. Personally I prefer to use both charts the 5min and tick charts.

The 53k upwave was the no demand bar I traded, on the second approach we had higher demand with 77k (not that overt) but nearly twice as much as the previous down wave, hence no short.

Via your chart its clear to see effort vs result in wave format. Compare both downwaves 41k and 97k with over double the volume on the latter, we have made the exact same downside progress (within a tick or two). So we know that over half that volume is actually buying, it has to be otherwise we would have made a much larger leg down. (hidden buying) When we look deeper into the wave bar by bar, we have evidence of buying as per Chronicle. You understood the effort vs result principle as you have clearly noted, its just takes time to build the confidence and pull the trigger in real time.

The importance of waves has to be used in context and is nothing more than individual preference. However, the lower the timeframe (intraday) higher the importance, personally I don't use wave volume for anything over 60m for setups, perhaps for analysis - this is discretionary, a mere personal preference

Hope this helps

F
 
Last edited:
From an aspiring trader of the same discipline looking to put in the work to get where you are - thank you for each and every post. There is a gold mine of knowledge in this thread, I will be catching up for quite some time.

Thank you very much for the kind words, it genuinely pleases me that others can benefit from the Chronicles.

As a fellow Wyckoffian (noted your reading list) you have made the hardest decision in all of trading - that is of method/strategy.

If I could give one piece of advice DO NOT STRAY (try not to think of adding a moving average or any additional indicators, wait until you have mastered the core principles) This method works, has done for a 100 years. Stick with it, put in the hours of screen time/practice etc. Go through the fundamentals day in day out, and the markets will literally open up for you too.

Good luck,

F
 
ES 2nd August 17

Wyckoff and VSA principles at play in today's action:

Waves
Effort vs. Result (waves and bar)
Price action aberration
Climatic bar
Change of behaviour

and some Bar by Bar analysis

PDF attached (4 pages)
 

Attachments

  • ES020817-1.pdf
    392.6 KB · Views: 373
If I could give one piece of advice DO NOT STRAY (try not to think of adding a moving average or any additional indicators, wait until you have mastered the core principles) This method works, has done for a 100 years. Stick with it, put in the hours of screen time/practice etc. Go through the fundamentals day in day out, and the markets will literally open up for you too.

Good luck,

F

Advice taken - thanks again.
 
ES 3rd August 17

Wyckoff and VSA principles at play in today's action:

Spring setup
VSA no demand setup
Waves
Effort vs. Result
Climatic Bar
Bar aberration (hidden selling)

PDF attached (3 pages)
 

Attachments

  • ES030817-1.pdf
    271.1 KB · Views: 387
ES 4th August 17

Wyckoff and VSA principles at play in today's action:

Apex's
Wave (no demand setup)
Trend Channels

PDF attached (2 pages)
 

Attachments

  • ES040817-1.pdf
    216 KB · Views: 410
ES 7th August 17

Wyckoff and VSA principles at play in today's action:

Spring set up
VSA no supply setup
Sign of strength (SOS) Bar
5m climatic bar?
Wyckoff thinking - background conditions (core component)

and a little on tick data and market behaviour 3 pushes....

PDF attached (3 pages)
 

Attachments

  • ES070817-1.pdf
    239.3 KB · Views: 383
ES 8th August 17

Wyckoff and VSA principles at play into today's action:

VSA no supply setups x 2 (tests)
Spring
Wyckoff Classic setup (rally back to ice)
Change of Behaviour
Waves
No demand
Trend Channels

and price action aberration (comes into play 150 mins later)

PDF attached (3 pages)
 

Attachments

  • ES080817-1.pdf
    276.5 KB · Views: 378
ES 9th August 17

Wyckoff and VSA principles at play in today's action:

Climatic Bar
Wave set ups x2
Trend Channel confluences
Spring setup
No demand rally
No demand set up

PDF attached (3 pages)
 

Attachments

  • ES090817-1.pdf
    422.5 KB · Views: 382
ES 10th August 17

Wyckoff and VSA principles at play in today's action:

Classic Wyckoff setup (rally back to ice)
Classic trend trading setups (weak rallies to a confluence level)
Testing upthrust setup
Waves
No demand (multiple)
Reverse use of trend line

PDF attached (3 pages)
 

Attachments

  • ES100817-1.pdf
    443.6 KB · Views: 340
ES 11th August 17

Wyckoff and VSA principles at play in today's action:

Change of behaviour
Shortening of the upthrust
Upthrust setup (perfect back ground conditions)
Apex setup (readable)
Waves

PDF attached (3 pages)
 

Attachments

  • ES110817-1.pdf
    449.7 KB · Views: 360
I just wanted to say this thread is eye opening. I use some of these same concepts, but putting it all together is incredible.

Is there any way you could talk a little about how you trade crude oil, or perhaps include your crude oil analysis along with the S&P?

Thanks again, I really enjoy reading and learning from you
 
Appreciate the kind words and feedback,

CL is a volatile beast, due to its nature I tend to swing trade. However due to the amount of requests, I shall produce a special edition of the Chronicles - A full weeks worth of trading using CL as my main instrument using intraday timeframes

Hope this helps,

F
 
ES 16th August 17

Wyckoff and VSA principles at play in today's action:

Shortening of the thrust
Change of Behaviour
Upthrust (untradeable)
Upside shakeout
Hidden selling
Effort Vs. Result
New momentum low (setup)

PDF attached (3 pages)
 

Attachments

  • ES160817-1.pdf
    350.5 KB · Views: 419
Top