replemished
Newbie
- Messages
- 6
- Likes
- 0
I have been studying a lot about Wyckoff, watching Todd Krueger’s VSA seminars, and reading “Master the Markets”. Pretty much anything I can get my hands on. I feel much more confident in knowing when a rally is weakening and thus choosing a time to get out of a stock.
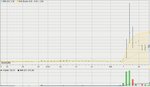
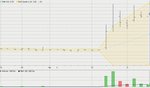
However, I would really appreciate someone talking me through what they see on the 2 attached charts. These charts show a price accelerating strongly from a very tight range.
My thoughts get a bit muddled here. Let me look at the second chart of SOLO. There is a high velocity and ultra high volume bar on the breakout. The volumes shown are confusing me because they were transacting the full amount of the companies issued shares near the billion mark. There was a LOT of interest in this share when it went up. I therefore assumed that the first up bar could be viewed as a “BUYING CLIMAX” in itself because everyone wanted to pile in and that I should be looking for further signs of weakness.
The next bar is on even higher volume and closes in the middle. Is this a sort of half UPTHRUST, half further BUYING CLIMAX? It definitely shows more selling is present because it closed off the highs. This shows the same pattern as seen in the first attached chart of SAR, but the second bar there was a definite UPTHRUST, and we would have been wise to get out at that point. However, these large volume mid close bars confuse me. What should I be interpreting/looking for exit wise when I see that?
In SOLO, I didn’t get out on that 2nd bar, but waited and noticed the 3rd and 4th down bars were on low volume, followed soon after with more up bars, one of which was a definite UPTHRUST. I took this to mean that with a second rejection of higher prices that it was not going to be rising any time soon. I got out. The presence of NO DEMAND bars after that gave me confidence in my decision. However, the falling on low volume on the 3rd and 4th bar still has me wondering if I was right?
What would everyone here deduce from the two charts?
Any help is greatly appreciated.
P.S. My trading style is not to hold on to a stock for huge rallies over many months. I get out after an immediate rally ends, be it after a few days or a few weeks. I may buy in after it has settled down for the next leg up.
Attachments
Last edited: