Current price action

millsy500

Well-known member
Messages
355
Likes
21
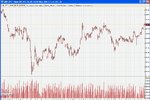
Heres a chart on some current price action on gbp/jpy mainly to see if I'm getting a better understanding or not, and to invite other views.

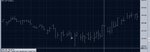
A up bar and increase in volume. weak bar. first sign of weakness
B same again. possibly get ready to short on any no demand bars
C does this bar cancel the previous 2 weak bars? higher volume with a big spike down closing near highs.
D test. You could buy here maybe

C bar puts the cat amongst the pigeons for me, price to go higher maybe.
 

Attachments

  • jpy 1hr.bmp
    1.1 MB · Views: 248
Millsy, I can't get a proper look at the chart you posted; an important question is what do you mean by volume?? I don't know of any GBPJPY futures contracts (which would give you "real" volume), so i can only guess that the volume you mean is "tick volume" - which is about as much use as a flacid w@nk.
 
Mr Gecko,

As a rugger chap, do you wear your collars turned up on your casual/sports shirts? Do you wear a rugby shirt if you go for luchtime drink at the weekend? I may regret asking this.

Grant.
 
Millsy,

good shout f you are long ATM; I have marked on my charts where your PA commentary begins, but I fear that, knowing what has happened, any view I come to is invariably biased. Good trading, where will you start to manage it (move stop to BE, targets etc...)?

Mr Gecko,

As a rugger chap, do you wear your collars turned up on your casual/sports shirts?

No; along with my blazer, I'd look like a w@nker!

Do you wear a rugby shirt if you go for luchtime drink at the weekend?

If there is Rugby on, yes (although it usually doesn't stay on for long. Do you know the game"C0ck or Ball"? ). At the weekend though, I respond only to 'Loretta'.


I may regret asking this.

Probably.


****.
 
Mr Gecko thanks for the comments........

The trade is now closed the target was around the resistance level which goes back a few months. 209 ish. The methods I'm trying to follow or at least starting from are based on work by Tom Williams so maybe I should have closed when we had some weakness or a reversal, pips are pips tho.... But thats the reason for this thread to hopefully improve on it.....

The stop was moved to break even + a few underneath the first swing HL after the entry btw...(5min chart)
 
Resistance

4 hr chart
 

Attachments

  • 4hr gy.jpg
    4hr gy.jpg
    157.9 KB · Views: 190
Millsy, I've had a look on my charts; by all accounts it seems to be a good trade - where did you get in? I believe you started to pay attention w/ price around the 207.00 mark, which turned out to be the turning point - I reckon the first opportunity to go ong was at about 207.25. Spot on with your exit, nice trade.
 
yep I was a little early on the entry in hindsight but was happy to get in at that level especially with the strength in the background. For me though at the moment is the reason for the entry. The pro's obviously wanted to use the bad news to buy at lower levels which to me was seen in the price action... Heres a pic of the actual entry....
 

Attachments

  • gpy 5mins.jpg
    gpy 5mins.jpg
    55.4 KB · Views: 149
Hmmmm - I presonally have pretty strong feelings on tick volume - can search to get what I'm talking about.

Given the nature of what it is / how it's generated, I think you can infer precisely nothing whatsoever from it about actual volumes going through. I'm totally serious - it's entirely bogus.

Just my $0.02 (but I do know what I'm talking about here a little)

GJ

I've always been fascinated at how tick volume seems to get such a bad press off many peeps here.

Perhaps the reason is because it's called tick volume and therefore people assume it is used as a substitute for volume.

Maybe if it was called something else like tick rate or numbers of price changes it wouldn't get such a bad rap.

To me tick volume is just a way of recording and displaying on a chart price movement from the lower TF's and nothing more than that.

There is no good or bad about tick volume, no right or wrong, tick volume simply is.

As to it's value as a trading tool then I think that's up to the individual trader and how he uses it and what he acheives with it.


dd
 
Last edited:
If I understand this correctly, Tick volume is simply the number of price changes during any given period (that is, the number of "ticks" up or down). If this is the case, then surely Tick Volume is just another technical indicator - or more likely, an existing technical indicator re-hashed.

The real problem I have with it is that it is misleading - Millsy, please do not take offence, but I believe you have been mislead by the title "tick Volume" and assumed it to be something it is not. AFAIK, tick volume is just the number of price changes per unit time - the thing that makes it misleading (despite the "volume" claim) IMO is that any one FX price will probably be some function of other prices available (and each contributors supply/demand conditions), not necessarily a genuine quote from a buyer or seller (I think it's called secondary pricing? or supplementary pricing?). The crux of the matter is that a change in genuine price has a domino effect on all of these other prices that use it as a source, so one "geniune" tick change might get recorded as 40+ "tick changes" as all the algo's catch up with each other.

Moreover, I'm not convinced that FX volume is of any meaningful application unless you are trying to deal at wholesale spot prices - the market is so deep that trades of $10m+ are counted as noise, and $10m spot would need circa $400,000 margin requirement - if you are dealing at this size, you would want to use a Prime Broker for credit in an institutional market - and if you need a PB, you should really know better as to pay any attention to Tick Volume.
 
GJ: "Grant, your account is showing a £10m deficit".

Grant: "Get a grip, GJ it's only "noise".

Grant.
 
No offence taken people. This is one of the reasons why I started this thread, I aint no expert but hopefully can start moving in the right direction.... no way do I think that tick volume is a worthy substitute for actual volume, whether it can be useful? an interest in a certain price level and ticks increase for example or no interest and ticks decrease maybe a possibility.I'm sure I'll have a good idea soon enough...... I have another realtime volume source from one of the large banks that I'm comparing with.. There is a large difference btw...
 
Last edited:
Mr Gecko,

Apart from 500 page instruction manual telling you how to buy/sell, I realy like it. My task for today, via the index (15 A4 pages of very small type), is select those items I consider relevant and study these.

Interestingly, I've been running TT with my cheap feed (for the tick charts), and it's the perfect set-up. Means I don't need to ponce around with various packages, but more importantly I don't need to compromise on my (original requirements). I can also run everything from one screen which I prefer.

The only drawback is lack of a professional news feed. This is secondary as I only trade reaction. And as long as I know the time of economic releases, that's adequate.

Grant.
 
Top