Analysis SP Emini 5th Aug

VSATrader

Guest
Messages
160
Likes
26
Hello All;

I might continue in this format for a while as and when I have time. It seems to me that not many people really understand volume and its relationship to the movments in price, so I thought I would show you some of my charts and some important points to consider.
(If you don't like it then don't read it)

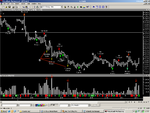
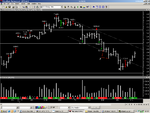
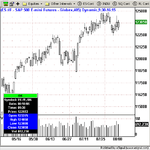
A; US non farm payrolls, not what everyone expected and I still don't know what the numbers are as I don't bother with the news, but weakness appeared the day before and this was and opportunity to catch people on the hop.

B; Prices try to rally but an increase in volume suggests that sell orders are out numbering buying orders and prices are forces down on the next bar. weakness is now confirmed and lower prices should be expected.

C; At this point the rest of the crowd is ready to try their luck and prices move sideways untill point C when supply swamps demand and the result is lower prices

D; There is a move to stop the decline but the power is too great as prices move higher to point E, I think this is probably stop losses triggered at point D on the first and second bar. You can see the effort it takes to change the trend of a market. There is a lot of activity here, but it is the result that we are intrested in, who gets the upper hand?

E; prices try to rally on low volume and fall back next bar, this tells us that the market is still weak and if we are short, we are not caught.

D; last bar, Support has appeared. High volume on this down bar seems to stop the down move, we do not know this yet, but the result of this force will tell us the intensity of the move.

F; Here is an old bottom in the past trading range to the left which we cannot see, but what we can see is that there is enough buying orders here to keep prices above this old low, so we would be looking for low volume on down bars for evidence the selling has mostly dried up.

G; Professional traders see little supply in the near background and start to mark up prices, but here we have locked in traders waiting to get out at break even as we have an increase in volume on this up bar and the next bar is level, so we know there must be supply on this bar.

i; Last bar with arrow on the volume. here we have a down bar with an increase in volume, this shows support and stays above the line at point F, as the next bar is up, we must assume this bar contained more buying than selling.

Monday's action will tell me what the rest of the week will do, but I think there was support after mid session on friday.

Regards VSATrader
 

Attachments

  • SPemini.png
    SPemini.png
    44.3 KB · Views: 779
VSA Trader.
I read Tom William's book long ago. It was in dire need of proof reading, since text did not refer to correct charts etc it was a difficult read - but after a struggle I fitted charts to description and got some sense out of the book. It was a great help in my understanding of the markets. My annoyance stems from the fact that I paid good dosh for a poorly written book - maybe any newer copy ( if there is one ) has been proof read?
 
VSA,

Thanks for the chart and analysis. I follow the ES intraday from a PV viewpoint and find it very interesting to see others interpretations - so an ES thread would be good.

Do the green/red arrows indicate trade placement, or are you just highlighting what you perceive to be bullish/bearish market action?

I was interested in your bullish 'no supply' bars, as I would generally view those inside bars as 'not much of anything' bars showing a pause and range contraction, rather than necessarily being bullish or bearish.

Yesterday was one of those days where if you just tracked the formation of local S/R as the day unfolded, and acted upon the PV indications when those levels were tested, then you wouldn't have gone far wrong (in hindsight ;) )
 

Attachments

  • snapshot-1.png
    snapshot-1.png
    69.3 KB · Views: 528
Last edited:
neil said:
VSA Trader.
I read Tom William's book long ago. It was in dire need of proof reading, since text did not refer to correct charts etc it was a difficult read

Hi Neil;

I have proof read it for Tom, and the corrected version is now with the printers, and Tom was glad that I did re-proof it as there were no spell checkers in those days.

I like to start my own threads as my analysis is very close to Tom's and I don't want to get bogged down with all the firefights that seem to go on in these threads.

Hope you like my posts.
Regards
 
Thanks for the chart and analysis. I follow the ES intraday from a PV viewpoint and find it very interesting to see others interpretations - so an ES thread would be good.

Thank you.

Do the green/red arrows indicate trade placement, or are you just highlighting what you perceive to be bullish/bearish market action?

The market works on: Supply and Demand, and No supply and No demand. These points are what the market all boils down to: The result of activity, mostly professional. Don't forget that we are only looking to follow their lead and trade in harmony with them(as Richard Wyckoff wrote 100 years ago)

I was interested in your bullish 'no supply' bars, as I would generally view those inside bars as 'not much of anything' bars showing a pause and range contraction, rather than necessarily being bullish or bearish.

These bars are what you are looking out for, they have the key to the puzzle.

Yesterday was one of those days where if you just tracked the formation of local S/R as the day unfolded, and acted upon the PV indications when those levels were tested, then you wouldn't have gone far wrong (in hindsight ;)

I could make millions with hindsight, so I don't use the term, but I belive that after 9 years of trading, these principles that Tom put into VSA are the only ones that work, otherwise I would not be in this forum.

Kind regards VSATrader
 
Welcome

VSATrader said:
neil said:
VSA Trader.
I read Tom William's book long ago. It was in dire need of proof reading, since text did not refer to correct charts etc it was a difficult read

Hi Neil;

I have proof read it for Tom, and the corrected version is now with the printers, and Tom was glad that I did re-proof it as there were no spell checkers in those days.

I like to start my own threads as my analysis is very close to Tom's and I don't want to get bogged down with all the firefights that seem to go on in these threads.

Hope you like my posts.
Regards

Look forward to more of your posts ;) ;)
 
SP Analysis Monday 8th August

Today, the supportive buying that appeared did not hold today, and the old low at 1227.5 took some work to process orders that some traders were counting on to hold up.

1: Ultra high volume on an up bar started 2 bars previous, this was followed by the next bar down were you could short as you now have weakness in the background. The market now falls and recovers to point 2.

2: Here we have an up bar on very low volume which is telling us that there is no buyers that matter to the upside, the traders that would have bought at point 1are probably hoping for a recovery to get out break even, but the next bar is down also telling us that the specialists have seen the weakness and withdraw support.

3; Enough buyers step in to halt the decline and some upside action starts to unfold, but this is met by resistance at point 4.

4; As prices are marked up, a surge in selling takes place, as an increase in volume on an up bar with the close, closing off the high would suggest that supply is overcoming demand, thus relieving the upside of it's momentum and the market starts to drift downwards.

5; On this bar we have a test, and some energy returns to rally prices, but is met with an Top reversal at point

6, showing all concerned who can read the market, that it is weak and will stay weak, confirmed by a ' No demand' bar immediately following the Top reversal.

7; The market has drifted sideways, but here we have another top reversal, showing more weakness.

8; Enough stop losses are triggered, or enough buyers ' short covering' step in to stop the decline , but this does not last long.

9; we have another top reversal, and prices decline further, the next bar is up on an increase in volume, but is knocked down with the following 2 bars.

10; A down bar on Ultra high volume does at last seem to do the trick, and the decline stops, this could be more stops triggered, or more short covering. I do not know or care, it is the result on price and volume I am interested in, not who did what or who?

11; Supply hits this attempt to rally, so there is still more weakness to come, and we have 2 red bars showing 'No demand' which confirms weakness as there is no interest in the upside.

12; 2 up bars on ultra high volume is weakness, and I expect prices to decline further Tuesday as today the market showed any attempt to rally was swiftly knocked on the head. A look at the daily chart also shows weakness and if Tuesday the close is above the high of today with an increase in volume, then this weakness may not last. Don't forget that we have a shake out on the 7/7, and if enough traders were shaken out, any down move may be short lived.

I studied The undeclared Secrets that drive the Stock Market for many years and is the best book out there as far as I am concerned

Regards VSATrader
 

Attachments

  • SPemini2.png
    SPemini2.png
    41.7 KB · Views: 612
VSA - thanks for the informative posts. I have a couple of questions on your comments from Monday's chart.

VSATrader said:
8; Enough stop losses are triggered, or enough buyers ' short covering' step in to stop the decline , but this does not last long.

10; A down bar on Ultra high volume does at last seem to do the trick, and the decline stops, this could be more stops triggered, or more short covering. I do not know or care, it is the result on price and volume I am interested in, not who did what or who?

I'm not sure I completely understand your comments on stops triggered or short covering and how they relate to the price results. I'm interpreting your terms as follows:

stops triggered -> previous buyers now selling -> supply
short covering -> previous sellers now buying -> demand

Increased volume stops the decline in each case. The use of the word "or" is confusing to me - stops triggered or short covering. Given those two possibilities it seems it would be an issue of stops triggered being overwhelmed by short covering to stop the decline. And why not consider new sellers vs new buyers?

I'm also curious why those two areas are labeled with green demand labels. Is that an interpretation you make at the time the bars form or after you know the result of the price bars following the high volume event.

VSATrader said:
12; 2 up bars on ultra high volume is weakness, and I expect prices to decline further Tuesday as today the market showed any attempt to rally was swiftly knocked on the head. A look at the daily chart also shows weakness and if Tuesday the close is above the high of today with an increase in volume, then this weakness may not last. Don't forget that we have a shake out on the 7/7, and if enough traders were shaken out, any down move may be short lived.

Clearly two very high volume bars at the end of the day but why interpret them as supply? The result of the price action would seem to indicate that demand carried a greater effort over the final 3 bars by closing at or near the tops of the bars.

Thanks for your comments.
 
zorrotrader said:
I'm not sure I completely understand your comments on stops triggered or short covering and how they relate to the price results. I'm interpreting your terms as follows:

stops triggered -> previous buyers now selling -> supply
short covering -> previous sellers now buying -> demand

You are correct here, but in reality, it is not important as we are only intrested in the result of the increase in volume and the effect it has on prices. In Tom's book he say's that weakness always appears on up bars, usually at or near the top of a rally and shows a negative opinion of the smart money(as we are small contract traders) as the heard see rising prices they start to buy, giving the smart money an opportunity to sell at a profit and even short selling if there is sufficient demand. Most traders use a stop loss and the smart operators know this. It is well documented that floor traders mark prices around to catch stop losses. When you see high volume on up bars and then a decline, those traders that bought at the top must be under pressure as prices decline, so at some point they are forced to sell to reduce their losses, hence I say catching stops.

zorrotrader said:
Increased volume stops the decline in each case. The use of the word "or" is confusing to me - stops triggered or short covering. Given those two possibilities it seems it would be an issue of stops triggered being overwhelmed by short covering to stop the decline. And why not consider new sellers vs new buyers?


I'm also curious why those two areas are labeled with green demand labels. Is that an interpretation you make at the time the bars form or after you know the result of the price bars following the high volume event.

I always assume that if something is cheap enough, someone will buy it, especially if someone else is losing money on it, to buy cheap you buy on the decline, and to sell including short selling you sell into rising prices(no demand)


zorrotrader said:
Clearly two very high volume bars at the end of the day but why interpret them as supply? The result of the price action would seem to indicate that demand carried a greater effort over the final 3 bars by closing at or near the tops of the bars.

As above, Tom say's that weakness always appears on up bars, and strength always appears on down bars, but if there is a bottoming out in the background, then this can weaken the force of these high vol up bars, It now seems that insiders steped into the market and aborbed supply, ahead of the Fed talking today which I did not know as I don't bother with that.

We will never know the truth about who is buying or selling, so I don't waste my time trying to figure it out, but the point is that a group of players were active and we watch carefully for the result, which we try then to hitch a ride and make money. That is our objective, not to guess who did what and when.


Thanks for your comments.[/QUOTE]
 
SP Emini Tuesday 9th

Well I did expect prices to fall, if not to be re-absorbed in the early session, but in boxing they say that if you know your opponent to the floor and he gets back up, he must be stronger that you first thought. At point 10 on yesterdays chart, we saw strength come in, the volume was not that high, but must have been enough to take the sting from the weakness, alot of supply must have been taken out over that last 24 hours, I wait with interest to see the result.

Not much to report today as the Fed were yapping and the smart money probably took the opportunity to shark a few traders out for a while.

1; Selling into an up move, prices here are being contained, and kept in a narrow channel ahead of what the smart money know that Greenspan will say about the economy. The is no continued selling and a test of supply(SOS 3) allows prices to drift higher.

2; Again, supply hits the market and prices are knocked back down.

3; Prices are supported to stop a further decline and keeps everything in the channel, now we know the market is being manipulated for an effect to take place later.

4; As prices are catapulted up, massive selling takes place and knock prices back down, and is a good opportunity to short and put some greenbacks in the bank.

5: Below the channel, support comes in to force prices back up, and at this point, I believe the market is being whipsawed to clean out the herd.

6; Prices are now resting on the top of that resistance channel and will need a lot of force to overcome the new top in the background at point 4.

Outlook: There is a lot of strength, but also weakness. I do not believe either side have the upper hand at the moment, bit I think there will be a tug of war, I am at the moment biased to the upside for now, but this could change quickly and I reserve the right to change my opinion as I see conditions change.

Regards VSATrader
 

Attachments

  • SPemini3.png
    SPemini3.png
    38.1 KB · Views: 500
Analysis SP Emini 10th Aug

Well today the market gapped up at the open, which is a bad sign and came off. You have to have an open mind, and this market is thin at the moment and is evidently under manipulation so it is a day traders market and should be treated as such until a longer trend emerges.

1; Wide spread up through an old resistance line is bullish, then appears to rest before bouncing off the line an up at point 2.

3; An up bar with a substantial increase in volume with the next bar down is bearish, supply has capped the top end of the market and prices decline to bar 4.

4; Upthrust, with an increase in volume means supply is still evident, followed by a 'No demand' 2 bars later and the market starts to trend down.

5; A wide spread to lock you in if you bought at the top, and to lock you out if you are looking to short. With the high volume, the down trend is capped for a few bars.

6; Another Upthrust, with confirmation with next bar down is weakness and now we can add our trend lines for the session.

7; Wide spread down with the low, lower that a previous support level and again to lock you out if you are waiting to short as prices collapse, with the intention to frighten you into the sidelines(Professional operators do not like the crowd to make money, they consider it their market, and you are there only to lose).

8; Buying comes in again like yesterday, but over 2 bars thus stopping price declines any further, in fact prices start to rally as below the trend line is considered oversold and hence buyers that now consider the market cheap will step in and buy.

Anyone long below bar 1 would be under pressure at bar 5, and hence I believe many long positions would have been closed, possibly with stops, and many others manually closing out.

I will be interested to see Thursday if the trend line holds or is broken.

Regards VSATrader
 

Attachments

  • SPemini4.png
    SPemini4.png
    36.7 KB · Views: 467
Hi VSATrader
I somehow suspect you are Tom Williams himself. My respect !!! I have your book, have read halfway through and it is absolutely unique in concepts and contents.

Can I ask you something? All the chart examples in the book are intra-day. Is the theory also as valid on daily charts, and all markets/timeframes?

I am also thinking of having al look at Tradeguider.
 
pratbh said:
Hi VSATrader
I somehow suspect you are Tom Williams himself. My respect !!! I have your book, have read halfway through and it is absolutely unique in concepts and contents.

Can I ask you something? All the chart examples in the book are intra-day. Is the theory also as valid on daily charts, and all markets/timeframes?

VSATrader is Sebastian Manby, Tom Williams' protegé. He also has an article in the Knowledge Lab on Volume Analysis.

http://www.trade2win.com/knowledge/articles/general articles/volume-spread-analysis

The content of Tom Williams' book is based on Richard Wyckoffs work, and it's not very uniqe, but he does a good job in "updating" these old principles to our modern days.

It is one of the books that has helped me the most in my trading. I really believe that studying the two basic elements, price and volume, is the way to become successful in this competitive business.

These principles work on all markets and all timeframes. A chart is a chart.

If I got something wrong I'm sure that VSA will correct me :cool:

If you want to read more on Price/Volume analysis, do a search on dbphoenix on both EliteTrader.com and here on T2W.com and start reading his threads/posts. There is a lot of free quality stuff there.

-Skog
 
pratbh said:
Hi VSATrader
I somehow suspect you are Tom Williams himself. My respect !!! I have your book, have read halfway through and it is absolutely unique in concepts and contents.

Can I ask you something? All the chart examples in the book are intra-day. Is the theory also as valid on daily charts, and all markets/timeframes?

I am also thinking of having al look at Tradeguider.

Hello pratbh;

I'm afraid Skog is very much correct, Tom's eyesight is so bad now that he would not be able to see the text, unless someone were there, and I am back in the Channel Islands, but am in constant contact with him. Everything I know comes from Tom's book ' The undeclared Secrets' and I think that I proved this principles to be correct.

pratbh said:
Can I ask you something? All the chart examples in the book are intra-day. Is the theory also as valid on daily charts, and all markets/timeframes?

In reply to your question, yes, these principles work on all time frames in any liquid market, the SP Emini is a good example of a liquid market. Volume is the key factor. I have used Tom's program since 1996 when it was v4 for windows 3.11 and took me quite a while to master(if that is the correct word)

If you read the PDF article on Tom's website, you will see that he took the wyckoff course which he now thinks is not that great, but it was a start. Tom really developed his skill when researching the indicators for the VSA program back in the late 80's.


Thank you for your praise.

VSATrader
 
Hello VSATrader,
Excellent thread. Thank you for starting this.

It would be a great if you can also start a similar thread with daily charts, using the FTSE100 maybe? That way UK based EOD traders will also benefit.

Many thanks.
 
Analysis SP Emini 11th Aug

Well, an up and down day today with heavy supply coming in around 1 hour after the open, with a double top to confirm weakness which developed into a down trend until about 1 hour from the close when it broke out and rallied up to the high around this morning before moving sideways. The daily char is now most interesting as we have high volume on an up bar with a narrow spread(weakness). So I might wait in the wings for a short on the daily chart, but will have to see how that develops for now.

1; Weakness hits the up move, but is quickly countermanded and prices continue up with the volume increasing. It then struggles through the old low until the supply swamps demand.

2; High volume on an up-bar with the next bar down is weakness, but you would now be looking for a low volume up bar on a narrow spread, or a top reversal, or an up-thrust(see Tom's book) on which to short.

3; Red bar is a ' No demand' followed by a top reversal and confirms that the market is genuinely weak and we now have our down trend to which prices should trend in harmony.

4; The trend is genuine as some buying hit the bottom of the trend at this point, but is too weak to hold.

5; Another attempt to break the trend, but there is too much weakness around to stop the down trend at the moment. Low volume on an up bar signals that the smart money have withdrawn support, so any rally is short lived.

6; Stops hit, and buying power enters the market and is enough to stop the down move. There must have been enough demand by whoever to stop the decline anymore, and as the next bar is up we can see that there must have been sufficient support at that level to stop it.

7; Prices drift up to the low of the trend line and is hit by supply, possible old locked in traders trying to close out break-even on the 2 bars before point 5 on the chart, and prices decline again.

8; More support, and demand now is very evident at this level, again the next bar is up, and prices start to climb and the market is considered oversold at the bar, and prices being cheap etc.

9; A little more selling, and prices drift off again, but interestingly, as prices decline, they do on low volume and professional traders must have picked up on this as aggressive buying now takes place after the green 'Test'.

10; Again traders short at point 2 & 3 are being forced to cover as the heavy volume on these up bars show an ability to level out the market. An interesting bar is the one before the last green bar on the chart, as it is down, but on high volume(buying). The last bar looks bearish but tomorrow is another day. I think the we have seen a lot of selling today and on the daily chart we have weakness. I would not be surprised if the market declines Friday as it has failed to break todays top 1 hour after the open.

Regards VSATrader
 

Attachments

  • SPemini5.png
    SPemini5.png
    41.2 KB · Views: 381
  • SPemini_daily.png
    SPemini_daily.png
    28.8 KB · Views: 388
Last edited:
VSA

It looks like you are using esignal data to feed Metastock. Esignal has a problem with the display of volume on daily charts. The volume displayed on a daily chart actually belongs to the prior days price bar. Not 100% certain but looking at your daily chart it looks like the volume displayed for the 11th actually belongs to yesterday - the 10th and a fed day. I have attached a couple of charts from eSignal to show the problem. One is a daily chart with the mismatched volume. The other is a 405 minute chart that captures only price and volume data between 9:30 and 16:15 ET. Todays real-time volume was not as great as yesterdays volume. Esignal doesn't seem too interested in fixing the problem.

Thanks for the informative posts.
 

Attachments

  • SPemini-Daily.png
    SPemini-Daily.png
    13.4 KB · Views: 302
  • SPemini-405min.png
    SPemini-405min.png
    13.4 KB · Views: 308
Excellent analysis VSATrader.

I was trying to find my way in trading using lagging indicators, but after a while I found that price and volume is the only way to go. Nothing else will tell me as much as P&V itself.

Please continue your analysis as this will be very beneficial to everybody who wants to follow smart money. And as my knowledge will grow I will try to post my own analysis. As for now I am a humble student of price and volume.

Regards
 
I ve no idea what u r talking about ! I cant find any entries stops or targets

I can t c any recommendations. what is the value of this thread ?
 
Top