The S&P Chronicles - An Amalagnation of Wyckoff, VSA and Price Action

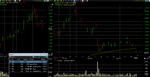
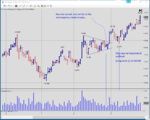
ES 13th September 17

Wyckoff and VSA principles at play in today's action:

Effort vs. Result
Mini Climatic bars (text book)
Upthrust/2 bar top reversal (setup)
VSA no supply test (setup)

and a price action aberration, shakeout bar?

PDF attached (3 pages)
 

Attachments

  • ES130917-1.pdf
    233 KB · Views: 308
ES 14th September 17

Wyckoff and VSA principles at play in today's action:

Climatic bar
Upthrust (setup)
No demand (setup, excellent background conditions)
Effort vs Result
Spring (setup)

and a powerful 3 bar formation

PDF attached (3 pages)
 

Attachments

  • ES140917-1.pdf
    208.8 KB · Views: 257
ES 15th September 17

Wyckoff and VSA principles at play in today's action:

Effort vs. Result (textbook example, and a setup)
Spring
VSA no supply test (setup)
Waves

PDF attached (3 pages)
 

Attachments

  • ES150917-1.pdf
    234 KB · Views: 292
Hello Feibel,

After going through the chronicles, in any given day we might get two to three high probability trades. Even though i currently only concentrate on ES, i would like to take these skills and try to apply in other markets(no necessarily for trading, but yo gain more experience in perfecting my entry points). In ES your main trading charts are 5 min and 3500 Tick Charts.

Can you share what are the ideal chart frames to analyze CL, GC and NQ for intrady analysis. I've 5 min charts for all these, but i would like to know what you would use for tick charts. (for me for CL and NQ, i'm experimenting with 800 tick with a retrace of 0.05 and 2 respectively).

Thank you,
novicetrader.
 
Last edited:
Hello Feibel,

After going through the chronicles, in any given day we might get two to three high probability trades. Even though i currently only concentrate on ES, i would like to take these skills and try to apply in other markets(no necessarily for trading, but yo gain more experience in perfecting my entry points). In ES your main trading charts are 5 min and 3500 Tick Charts.

Can you share what are the ideal chart frames to analyze CL, GC and NQ for intrady analysis. I've 5 min charts for all these, but i would like to know what you would use for tick charts. (for me for CL and NQ, i'm experimenting with 800 tick with a retrace of 0.05 and 2 respectively).

Thank you,
novicetrader.

The parameters seem fine; CL between 750-900 and retrace 0.05c, NQ between a 1000 and 1200 ticks with a 2 point retracement

Hope this helps,

F
 
ES 18th September 17

Wyckoff and VSA principles at play in today's action:

Upthrusts
Testing upthrust (setup)
Effort vs. Result
Classic Wyckoff - Distribution (very important)
Classic Wyckoff - Rally back to Ice (setup)
Overbought and Oversold conditions (trend channels)
Spring (setup)
Climatic bars

PDF attached (3 pages)
 

Attachments

  • ES180917-1.pdf
    378.1 KB · Views: 257
ES 20th September 17

Wyckoff and VSA principles at play in today's action:

No Demand (setup) (ND in a previous area of supply)
Effort vs Result - Wave (setup)
Climatic Bars?
Stopping Volume
Sign of Strength Bar
Superb Volume reading (histogram)

and a pure Price Action setup

PDF attached (3 pages)
 

Attachments

  • ES200917-1.pdf
    289.9 KB · Views: 291
In the report of 14/9, PW mentioned a 3 bar , no demand setup that can be useful at higher timeframes.

So, last weekend, I wrote a simple scan and here are the results. I still think you need the Mk1 eyeball to trim out some of the candidates. The green arrow is the start of the pattern.

Not too shabby though...
 

Attachments

  • no demand   TRUE.png
    no demand TRUE.png
    91.3 KB · Views: 319
Fantastic job!

Did you learn Wyckoff from David Weis or the original Stock Market Institute?

Thank you for the kind words and support.

All sources of Wyckoff have been studied, cherry picking core principles from the various authors over the years, David being one of those. I would always suggest to start with the original works, personally the book under Wyckoffs pseudo name Rollo Tape - Studies in Tape Reading was a major influence. The trading via the Chronicles literally is an amalgamation of Wyckoff, VSA, and logical price action. Pure Wyckoff is solely used for swing trading.

All the best.

F
 
Last edited:
ES 22nd September 17

Wyckoff and VSA principles at play in today's action:

Classic Volume analysis
Effort vs Result
Hidden Upthrust (setup)
Low volume testing (setup) (previous area of demand)

The importance of multiple timeframe analysis

PDF attached (3 pages)
 

Attachments

  • ES220917-1.pdf
    235.3 KB · Views: 259
ES 25th September 17

Wyckoff and VSA principles at play in today's action:

Upthrust (setup)
Effort vs. Result
Waves
Rally back to Ice (Classic Wyckoff setup)
Context
Trend Channel structure

PDF attached (3 pages)
 

Attachments

  • ES250917-1.pdf
    263.4 KB · Views: 327
Last edited:
ES 27th September 17

Wyckoff and VSA principles at play in today's action:

Confluences (important structural elements)
Change of behaviour (setup) weak pullback, excellent background conditions
Pure Wyckoff analysis (swell in volume)
VSA Classic No demand (setup - picture perfect)
Shortening of the Thrust
Effort vs. Result

Price action aberration and many subtleties

PDF attached (3 pages)
 

Attachments

  • ES270917-1.pdf
    330 KB · Views: 285
A couple of examples on a Daily chart of potential setups mentioned by PW in earlier Chronicles.
Some stock charts make it easy while others are unreadable.... If only they were all like this one.
 

Attachments

  • Low vol potential setups.png
    Low vol potential setups.png
    43.3 KB · Views: 375
ES 3rd October 17

Wyckoff and VSA principles at play in today's action:

New momentum high (setup)
Structure
Waves
Trend Channels
Back up the Edge of A creek (setup) - Classic Wyckoff
Compare and Contrast (Wyckoff thinking)

PDF attached (2 pages)

(Back to daily Editions of the Chronicles)
 

Attachments

  • ES031017-1.pdf
    277.9 KB · Views: 281
ES 4th October 17

Wyckoff and VSA principles at play in today's action:

Absorption
3 x VSA No supply tests (setup)
Effort vs. Result (a reversal of usual application)
Climatic Bars
Trend Channels
Structure
No demand?

and a mini scalp

PDF attached (2 pages)
 

Attachments

  • ES041017-1.pdf
    287.4 KB · Views: 298
5th October 17

Wyckoff and VSA principles at play it today's action:

Effort vs. Result?
Trend Channels (overbought and oversold conditions) & reverse use?
Structure
Trend (setup x2)
No supply

PDF attached (2 pages)
 

Attachments

  • ES051017-1.pdf
    208.4 KB · Views: 239
ES 6th October 17

Wyckoff and VSA principles at play in today's action:

Importance of Structure
Trend Channels
Classic Wyckoff - Accumulation (setup)
Absorption
Change of Behaviour (setup)
Relative and Comparative analysis (Wyckoff thinking)
Multiple time frames
No supply
No demand

A very important edition of the Chronicles, many Wyckoff concepts

PDF attached (3 pages)
 

Attachments

  • ES061017-1.pdf
    326.4 KB · Views: 233
Last edited:
ES 9th October 17

Wyckoff and VSA principles at play in today's action:

Multiple Time Frames
Overbought and oversold Conditions
Trend Channels
Effort vs. Result
Change of Behaviour (waves)
Confluences
Ease of Movement
Axis line (important structural element)
Comparative and Relative Analysis (Classic Wyckoff)

PDF attached (2 pages)
 

Attachments

  • ES091017-1.pdf
    270.1 KB · Views: 262
Hi Feibel,

I thought i know how to draw reasonable good support and resistance lines on my chart, but, upon seeing you had drawn a support at 2530 on the daily chart - i got confuse.
Can you explain Why you determined that level as support, and if possible how you draw them.

Seems to be basic for most, but would definitely love to hear from you.

Thank you very much.
 
Good question:

The area has had two touches; first being the daily high and then two days later the market bounced off the same price (creating a daily low) - buyers for whatever reason find this level to be of value.
Due to the lack of structure (as breaking into fresh new ground) when the market proves a level, it has much more significance and must be noted. Whose to say that if we revisit the same area again that buyers wouldn't be interested? we don't know, however we do know that support turned into resistance at the same price and this is normal workings of the market (S&R behaviour)

Hope this helps,

F
 
Top