The mr.marcus tribute thread

wannagetstacked

Well-known member
Messages
287
Likes
11
I've always been a huge fan of mr.marcus's posts but unfortunately never had the chance to meet or speak to him back in the day. I go back to the posts I saved of his often, and usually glean something from them that I hadn't considered before, which I can then go and investigate. He's probably the only trader I've paid attention to outside of my own studies.

I must be at or beyond 10,000 hours, maybe even 20,000 hours of purely studying price and volume charts, across many instruments and timeframes, over 3 decades now. I don't think I'll ever stop, even if there was no money to be made. It's an obsession. It's the greatest game in existence.

In the unashamed hopes of tempting him into a discussion on here (or in private ;-) ) I'm going to try some tribute analyses. If anyone knows Mark and can point him towards this thread that would be great.

In this thread I'll stick to daily stock charts. I feel too old for smaller timeframes, but feel free to post any chart and your analysis.

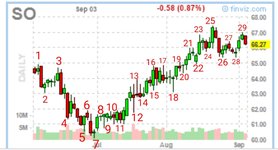
I've roughly numbered most of the turning points for ease of discussion. Let's dive in.

iMarkup_20210904_081106.jpg


Now I certainly don't have the reverse engineering skills that Mark demonstrated, and of course I could look at the chart before the period shown, but let's assume I haven't.

I somewhat randomly picked this chart because it looks technically pretty. I'll start my comments on the next post because it will be annoying if something crashes and I have to write out the above again.

Cheers

Nathan
 

Attachments

  • iMarkup_20210904_081106.jpg
    iMarkup_20210904_081106.jpg
    153 KB · Views: 106
That's a name I had forgotten but now I recall giving his posts a lot of respect at the time. I wonder what happened since....
 
Before getting onto my analysis I'll just give a background of my ups and downs since joining t2w back in the early 2000s. I started primarily day trading futures in the early 00's and then got sucked into playing/coaching online poker for a living. I tend to be obsessive about my interests and was fully dedicated to studying/playing/coaching online poker for many years, with trading on hold, but still studying charts.

As health issues took over, and online poker started to dry up and become very stressful, I transitioned back to a normal job as a tax analyst (which I really enjoyed) with chart analysis still an obsession. Despite my seemingly risky endeavours with poker and trading, I have always hated losing, and don't like to gamble unless I know I'm going to win.

Around 5 years ago I decided to try trading for a firm to hopefully ease my risk tolerance, but just didn't have the time to dedicate to day trading. I was funded with topsteptrader but they seem to have now removed all the blog links and my stats from that time. Needless to say I still disliked losing and had a very straight steady equity graph, but rarely took day trades.

Screenshot_20210904-091913~2.png


This foray back into funded day trading made me realise I preferred the slower pace of stocks, and daily charts fit my lifestyle/health/family needs. At the time I don't think there were funded trader options outside of futures day trading.

Further health issues followed, being a dad, buying houses, and all the other responsibilities of life.

I'm now in a great place, and still excited to wake up and study hundreds of stock charts everyday. I'm a simple person with simple wants and needs. I've never been driven by money and actually placing a trade is just a byproduct of my love to study and apply the scientific method to the markets.

This trading lark is definitely a marathon, not a sprint. Enjoy the process of learning.

I promise I'll get on to analysing the chart above at some point!

Cheers

Nathan
 
Before getting onto my analysis I'll just give a background of my ups and downs since joining t2w back in the early 2000s. I started primarily day trading futures in the early 00's and then got sucked into playing/coaching online poker for a living. I tend to be obsessive about my interests and was fully dedicated to studying/playing/coaching online poker for many years, with trading on hold, but still studying charts.

As health issues took over, and online poker started to dry up and become very stressful, I transitioned back to a normal job as a tax analyst (which I really enjoyed) with chart analysis still an obsession. Despite my seemingly risky endeavours with poker and trading, I have always hated losing, and don't like to gamble unless I know I'm going to win.

Around 5 years ago I decided to try trading for a firm to hopefully ease my risk tolerance, but just didn't have the time to dedicate to day trading. I was funded with topsteptrader but they seem to have now removed all the blog links and my stats from that time. Needless to say I still disliked losing and had a very straight steady equity graph, but rarely took day trades.
Interesting stuff. Look forward to reading more (from you and maybe Mr Marcus!) soon.
 
Despite my seemingly risky endeavours with poker and trading, I have always hated losing, and don't like to gamble unless I know I'm going to win.

This begs the question - is there anyone who doesn't have the same view ?
 
iMarkup_20210904_081106.jpg


Where have we come from?

The volume around the low at point 7, of circa 4m, occurred in a relatively small range, but doesn't appear exceptional when compared to the volume at many other turning points with smaller candle ranges, such as point 1, point 2, point 21.

This may suggest the low at point 7 isn't following a fall from much higher prices than point 25, as the volume doesn't suggest such a big change in market direction.

If we believe that we haven't come from recent highs above point 25, then this would potentially mean a lack of recent stops above to fuel a move higher.

On a side note, other turning points also have larger or similar volume when compared to the low at point 7, including point 4, point 12, point 15/16, and point 25. These turning points however occur on candles with a bigger range, which makes me less confident when comparing to the small range candle at the point 7 low. As the candle at the point 7 low has a small range, we know that the volume of 4m occurred somewhere around the low in this small range.

Knowing that a lot of volume occurred in a candle covering a small range near a turning point, rather than the volume potentially occurring earlier in the leg (which may be the case when the volume covers a larger candle range at a turning point), is significant information as it increases the chances it is a signal of intent by large/smart money. Conversely, the volume in the larger candle turning points, at points 4, 12, 15/16, and 25 did not necessarily trade around the low/high of the turning point as we can 't be sure where the volume traded.

I'll move onto my thoughts about the first move in the chart from point 1 down to point 7 next.

Cheers

Nathan
 
iMarkup_20210904_081106.jpg


Points 1 to 7

There is a decrease in the rate of change (The angle of the move from one point to another), when comparing the legs down from point 1 to 2, then from point 3 to 5. In other words, the move from point 1 to 2 is much steeper than the move from point 3 to 5.

There is also a subsequent increase in the rate of change in each leg up, with the move from point 5 to 6 much steeper than the move from point 2 to 3.

These shifts in the rate of change in each leg of the initial down move from point 1 to point 7 signal a potential weakening of the move.

Knowing that the rate of change in each leg of the down move shows a potential weakening of the trend, we can look for further clues in the volume.

We can see a continual decrease in the volume from turning point 1 to points 3, and 6, and as each of the bars at these turning points have a small price range it gives us greater confidence of a lack of large/smart money in these areas pushing the move further down. If each of these turning points are made up primarily of weak money, this will also provide fuel for a move up as their stops get taken out.

If we see a lack of large/smart money taking prices down at turning points 3 and 6, we would ideally want to see increasing evidence of their presence at turning points 4 and 5. Turning points 4 and 5 do have larger volume than turning points 3 and 6, on a bar for bar basis, but the price range of bars 4 and 5 is much bigger, with the volume not guaranteed to be bunched up near the end of the bar.

Due to the above we believe weak hands may be carrying the move down from point 1 to point 7, but don't have conclusive evidence of smart/large money coming in at turning points 4 and 5 (I've excluded point 7 in the analysis as we should/could have entered a potential long position before the bar at point 7 closes). I say the evidence is not conclusive because the volume at point 4 and 5 might not be bunched up at the ends. These factors may go towards explaining why the move up from point 7 to point 25 did happen, but is shallower than the move down from point 1 to point 7.

@mr.marcus - hopefully you see this and have time to send a quick PM, post, email, letter, postcard with your thoughts, heck even if it has to be by carrier pigeon, I'll make it happen! It would be greatly appreciated.

Cheers

Nathan
 
Top