All you need is... a chart

Taking the opposite view of "I don't read the news I just look at a chart"

- Reading the news today (without looking at a chart) I think the Dow will tank down! Anyone got a chart that says different?
=====================================================

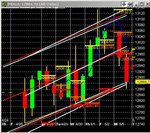
LOL --- not a hard one to play as its day 2 of downside move already which started 3-4 days ago with a T_D type "inverted hammer" followed by a long legged wide doji, which is still good enough to be called a hammer !

charts show DOW to be right at LRC reversal point (12884.13) which i would accept, but indicators also forecasting 12809 with 12830 also showing as support -- normally at 2.5 - 3 days downside and playing at bottom LRC, i will go flat and wait till the london mkt closes to see where the USA will take it, which is a good chance of lower than this minute !

heck, may not go flat based on indicator strength !

mp
 

Attachments

  • DOW.jpg
    DOW.jpg
    66.4 KB · Views: 236
Last edited:
=====================================================

LOL --- not a hard one to play as its day 3 of downside move already

charts show DOW to be right at LRC reversal point (12884.13) which i would accept, but forecasting 12809 with 12830 also showing as support

mp

I have 12860 and 810 as support, but it's not like it's an exact number...
Sorry getting off-topic here myself.

The point is to illustrate that the news doesn't determine the direction of the market. So like I said, we'd expect this to go up from support.
 
MP --- to show my LOVE for all the generals here !

in my never ending quest to protect and serve, from "slink" the forex ferret, "the HOLY GRAIL" of short term trading.

an observation, made a few years back, rarely released to the public, but since there is such an overwhelming large number of high ranking people here, believing in radical theories, i must share it with you !
 
Don"t no specification for TANK but think it will go lower before it goes up :confused:

No reason to think about what it will do... The story is played out on the chart. So far the story tells us we confirmed support at 12860. An attempt back to 12920 is now the first step, if that fails it will imply weakness and we might enter a short.

MP6140: try and stay on topic please... you were doing fine, don't go off in the wrong direction again. Thanks.
 
Last edited:
No reason to think about what it will do... The story is played out on the chart. So far the story tells us we confirmed support at 12860. An attempt back to 12920 is now the first step, if that fails it will confirm weakness.
=-=====================================================

sorry firewalker -- you asked what timeframe and i forgot --- H1 for the DOW which "should" bounce here for the short term, but continue downside before EOD !

mp
 
mp

good observation regards london close, not sure about the chart, its gettin better :)

found that to be so 4:30 & 5:30 of interest and price action in gap (Fut)
 
=-=====================================================

sorry firewalker -- you asked what timeframe and i forgot --- H1 for the DOW which "should" bounce here for the short term, but continue downside before EOD !

mp

good post

I have ftse short at 205 - 210 ish, see what time train gets into the station before I decide
 
Ftse already at level

Dow lagging well short of pdl, plenty of overhead room imho

Flat for rest of day, to dangerous for weedhoppers at this end of the day :)

Latter all and good luck
 
Last edited:
- Reading the news today (without looking at a chart) I think the Dow will tank down! Anyone got a chart that says different?

So far very predictable reacting, DOW at 860 like I said which was the next support...

So far the story tells us we confirmed support at 12860. An attempt back to 12920 is now the first step, if that fails it will imply weakness and we might enter a short.

The DOW is now at 12920.

I want to thank postman for helping me bring over my point. The news has nothing but a temporary effect on the markets. Despite what some people might argue or believe, there are no "non-technical" days. Price reacts in the same ways it will always do, whatever traders might believe about the news.

Yes I was wrong about my long on the NQ, but personal strategy and tactics aside, the NQ found support lower and the support on the DOW was confirmed. Anyway, I don't want this thread to go into the direction of personal trade analysis or strategy. There's plenty of opportunity to do that elsewhere.

Specific examples of trades or charts including an analysis with news are therefore welcomed. Trader_dante and bluetipex already gave two fine examples, one with the other without a chart.
 
leave that for mp to expain

Ftse almost to hr highs at pwh on the 4 pm shift change :)

Dow getting to her lows in her own good time, looks like the rest have left her standing today

Off for a shower

mp ~ no silly charts, plain bear charts please :)

Latter,

Off to get my slice of humble pie ready, better than Slippers I suppose ...just :)
 
The value of the chart... TA is all you need

Those who went long on the support 12860, are now >100 points in profit, and counting. 12970 is resistance, so no one could blame the trader for exiting here, or at least taking some off his position.

I invite anyone out there to show me evidence that short term trading based on fundamentals, gives you better results than what I've shown in the examples of last two days, based on pure, technical action.

The answers lie in the chart. If you can't find them, it's not the fault of the chart. I say again, TA is all you need. Throw your Financial Times in the bin and get a pencil and some graph paper and print out some charts. It'll do you more good than reading in the papers, what's already been told in the chart.


lol...Well personally no argument with your last two days and if you'd done it on the FTSE I'd stand you a drink for supporting my fundamental trades ;) how else is the price going to get where I want it to be unless you help buy it ;)
 
what about using both..... fundamental analysis for overall market direction and keep this updated so you always know whether we are in a bull or bear market or consolidating, then apply tecnical analysis on a daily basis and trade only in the direction of the market the fundmentals analysis has told us we are in at present. This is what grey1 does and seems to do pretty well. Its kinda how i trade at present but not with stocks..........the only thing of course is finding a reliable source for your fundamental analysis.
 
lol...Well personally no argument with your last two days and if you'd done it on the FTSE I'd stand you a drink for supporting my fundamental trades ;) how else is the price going to get where I want it to be unless you help buy it ;)

I doubt fundamentalists don't care about short-term fluctuations, let alone intraday moves :)

Seriously, two days don't mean a thing. Which I why I posted at least 50 days worth of analysis spread around trade2win in several different threads.

I'm all ears if you - or anybody else - could point out what fundamentals gave you a buy signal around 12860 today?
 
what about using both..... fundamental analysis for overall market direction and keep this updated so you always know whether we are in a bull or bear market or consolidating, then apply tecnical analysis on a daily basis and trade only in the direction of the market the fundmentals analysis has told us we are in at present. This is what grey1 does and seems to do pretty well. Its kinda how i trade at present but not with stocks..........the only thing of course is finding a reliable source for your fundamental analysis.

General consensus is the we are in a bear market. So you're saying we should only trade from the short side? Have a look at the number of up days since the beginning of this year, there are plenty, probably more than down days. Then take a closer look at the point and %-gain in those up days. 11 and 18 March 2008 for example, were one of the greatest %-gain days for the DOW. More importantly, almost all of the biggest gain days ever took place in a bear market (statistics).

If you're going to stick to trading from one side, you'll be missing out on numerous profitable opportunities. Yes, there's the argument for trading with the trend... but since the the January low, we've not really had much of a trend, rather sideways consolidation.

I'm sure Grey1 is doing fine, but I don't need the baggage of fundamentals to tell me something which is shouting from you within the chart. And what if fundamentals tell you to go long, but technicals tell you to short, and vice versa? The more elements you use, the more confusing it's going to get. KISS.

I encourage anyone that can show me solid proof that he can make more money out of the markets by short-term trading with applying fundamentals to step forward, and show me some charts and trades like I have done. I suspect it's going to be a long wait.
 
MP -- a special gift to all the generals here !

Those who went long on the support 12860, are now >100 points in profit, and counting. 12970 is resistance, so no one could blame the trader for exiting here, or at least taking some off his position.

The answers lie in the chart. If you can't find them, it's not the fault of the chart. I say again, TA is all you need. Throw your Financial Times in the bin and get a pencil and some graph paper and print out some charts. It'll do you more good than reading in the papers, what's already been told in the chart.

Proud as a peacock, isnt he ?????

LOL

depending on how long one wants to wait, which could be tomorrow, im seeing 13132 as bounce/resistance and 13188 and moving UP above that !

the "normal" reversal for the dow or forex is 12 noon EDT, except when news DOESNT come out at 8:30 am edt, which it did not today --- therefore the normal reversal for this kind of day is 1:30 PM EDT, which we see has happened. In fact, should you glance a bit, one would see that "something" happens every hour and a half, pretty much like clockwork !

the ONE PIECE OF LOVING ADVICE I SHALL GIVE TO ALL, taken from deep within the coffer, because everyone here is SO SWELL is to BUY (or sell) at a few minutes after 10AM EDT and HOLD to 2PM EDT, where you close the trade --- you can hold that as a "core" trade and also trade the reversals, such as we see now ! ----- once again, since news did not come out at 8:30 am edt, one holds to 3:30PM EDT and then covers --- check out a chart and see if it workds for you

There are exclusions, such as todays DOW which was a strong momentum day, starting later than usually, so one should be careful of doing a counter direction trade, except for very good short term flippers, as only one or two places will the currency alter its direction long enough to pass the 23% fib on a retrace, and thats VERY rare on day one !

mp
 
Last edited:
General consensus is the we are in a bear market. So you're saying we should only trade from the short side? Have a look at the number of up days since the beginning of this year, there are plenty, probably more than down days. Then take a closer look at the point and %-gain in those up days. 11 and 18 March 2008 for example, were one of the greatest %-gain days for the DOW. More importantly, almost all of the biggest gain days ever took place in a bear market (statistics).

If you're going to stick to trading from one side, you'll be missing out on numerous profitable opportunities. Yes, there's the argument for trading with the trend... but since the the January low, we've not really had much of a trend, rather sideways consolidation.

I'm sure Grey1 is doing fine, but I don't need the baggage of fundamentals to tell me something which is shouting from you within the chart. And what if fundamentals tell you to go long, but technicals tell you to short, and vice versa? The more elements you use, the more confusing it's going to get. KISS.

I encourage anyone that can show me solid proof that he can make more money out of the markets by short-term trading with applying fundamentals to step forward, and show me some charts and trades like I have done. I suspect it's going to be a long wait.


I agree with you 100 %, i believe in cycles, I believe in overbought/oversold, I believe mm and brokers watch vwap, ma's etc, just like in any market, so I believe in TA and it works alone for sure, you only got to watch oscar and his analysis to see that.

I remember grey1 once telling me that his broker has never in something like 15 years of working as a broker, had never seen not one single technical retail trader ever been very profitable, while the fundamentalists and fund managers had. This is the same attitude amongst some prop houses as i once had an interview with one and they kind of laughed at me when i told them how i trade and they also said that is classed as retail trading and we do not do that here as there is no real edge. I disagree with them and now trading from home myself but just find the different attitudes interesting.
 
Top