You are using an out of date browser. It may not display this or other websites correctly.
You should upgrade or use an alternative browser.
You should upgrade or use an alternative browser.
Latest News Top Stories Market Pulse News Services
4:05 [FNB] First National Bankshares of Fla. to trade as FLB
4:03 [$RUT] Russell 2000 unofficial close down 8.5 to 557
4:03 [$SPX] S&P 500 up 1.9 to 1,111.5
4:01 [$INDU] Dow industrials unofficial close up 19 to 10,444
4:01 Earnings Watch Updates, advisories and surprises
CM,
oooh,magically they achieved, they managed to pull an extra 10pts out of thin air,to close at high of year,10 453.92.........thats a surprise
tradesmart
Experienced member
- Messages
- 1,286
- Likes
- 22
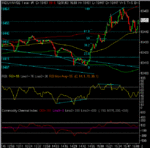
I figured that they'd make sure that the Dow ended the year on a high despite trading flat to marginally underwater for most of the day, so had little hesitation about going long at 10410 with just over an hour till the close...... 😎
Needless to say, I really wanted the last trade of the year to be a good 'un.... :|
and I love it when a plan comes together........ :cheesy:
all the trading indicators that ChartMan has highlighted time and time again worked in perfect harmony...
3-peak rsi PD for the entry, 3-peak rsi ND for the exit, 32 & 64 acting like magnets........
45 points @ $100/point in the bag in 50 mins.......(joke 😉 )
well the 45 points are real enough but the punt was a bit (lot) less than $100/point, but you can see the kind of money that can be made if you're prepared to go for it.....
must go now - the 'bubbly' is chilling nicely....... 😆
Attachments
Last edited:
tradesmart
Experienced member
- Messages
- 1,286
- Likes
- 22
Happy New Year to one and all
Tradesmart
I like your chart and explanation of how it comes to- gether with Chartmans indicators.
Chartman could you tell me where to find more information on how to use these indicators. Also what charting package should I be looking at, my own is not suitable I dont think.
This is my first post so hello to everyone
J
Charts are by SierraCharts.com and you can subscribe in the T2W shop. The RSI is 14. Data feed is from MyTrack.com although if you trade with IB, you can get the feed for free,subject to a minimum usage....
There is a huge amount of resources out there on the net for learning about TA. The bible book is by JJ Murphy, Technical analysis of the Financial Markets, again available through the T2W book store.
Look here:- http://stockcharts.com/education/IndicatorAnalysis/
More specifically, you can search the archives here for a couple of years of trading the dow intraday analysis.You can also download a weekly precis in word format of all the action, by Newtron Bomb.
Here's the link:- http://www.trade2win.co.uk/boards/showthread.php?s=&threadid=5063
Similar threads
- Replies
- 74
- Views
- 13K


