As this thread is going to be a continuation of my last week post on the Dow, I'm shifting that post here so the two chart can be viewed together:
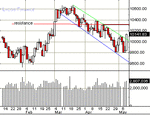
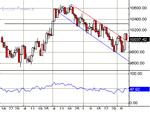
"The continuous higher lows forming a bullish wedge on the 5 min was suggesting a safe bet to go with an upside break which finally occured after a few weak trials....
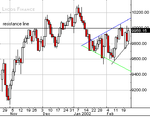
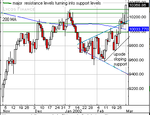
We've ended up with another expanding triangle on the daily chart suggesting more volatility ahead...only the upside sloping support line, the engulfing white candle on the daily chart, the higher low on the 15 min chart formed on the pull back after the rally to 10k, the hammer again on the 15 min chart, consolidation at the high on the 1 min chart all suggesting more to the upside before a downside move, still expanding triangles refer to volatility and it might be relatively safer to go with higher lows rule intraday... " (23-02-2002 04:20 PM)


