Best Thread The 3 Duck's Trading System

I think what I am getting at is best illustrated in the screen shots that both I and blancspa posted.
Cheers,

Reler


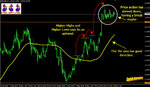
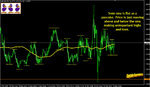
Blancspa screen shot was of a 5 min chart. On his 5 min chart the sma was flat, price on his chart looked like it was just bobbing up and down during a flat period maybe and making highs and lows just because it had to before it broke out.

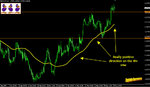
This is where a good trader can observe price action based on the 3 ducks system. The 4hr chart may have been trending for the past few weeks a bit like eur.usd is now and the sma on the 4 hour chart is clearly up (not flat). So in this example we are clearly looking for buying opps Now drop down to the 1hr chart - what does it look like? whats the 1hr sma looking like? whats the candles even looking like? What has price done is the last few candles? Get all the info out of these charts. Are you getting a better understanding of what price did and what it might do? Now drop down to the 5min chart, if it is like Blancspa's chart and moving sideways for the last few hours then the 1hr chart is probably creating doji like candles.

You as a savvy trader need to be taking all this price action in and asking yourself "will I buy/sell on a break of the last low/high on the 5 min chart that has been bobbing up and down for the past few hours or do scan back out and have a look at what is happening on the 1 hour chart. You might prefer to be entering a position based on a break higher/lower of a decent candle from the 1 hr chart if the market has been a bit unsure, at least a break higher will tell you that prices are going higher now :|

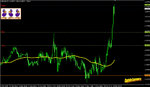
If prices have been going higher on all timeframes and you are happy with everything you will be setting yourself up for a buying opp. Now you get price action like what is happening on Blancspa's chart (opp way around of course). The trend is in place, prices may have rallied a few hours ago and the price action on the 5 min chart is going sideways because the market maybe resting after the previous rally. I want to get involved in this strong trending market so im not going to be as fussy as to which high it breaks on the 5 min chart - its telling me it wants to go up! Stop-loss of course in a location I know if its hit that im wrong.


On a final note: The 3 Duck's Trading System is a great tool for helping you observe price action, you need to be taking this information in and using it well. This "system" is not an auto black box thinggy! Of course some days a flashing green light would have worked on the Ducks, you would have make a few $'s and not have to use your head.

Successful Trading is different, you need to be savvy and on the ball, The 3 Ducks can be a powerful little tool but you need to do the rest of the work and extra thinking :-0


Is that coffee ready yet????


Andy
 
yep, that was a little pullback from the overall uptrend (my previous chart), perhaps +50 pips, and then back up again (about +400), and now market has been doing "resting" I guess, with the doji bit on top.
 
Here would be my thinking on eur.usd today starting off with the 4hr chart then the 1hr then then the 5 min chart.


What you will notice on the 5 min chart is that it never followed through after breaking the high of 1.3830, it quickly pulled back down, not really too surprised after yesterdays monster move up.


My thinking on this is:
Would I buy it today if it broke 1.3838? Probaby would if we where still during busy trading hours. Stop loss could be 30 pips away and hoping to pic up 2.1 - 1.5.1 risk v reward or if I really thought eur.usd could go a lot higher I might put my stop loss under the low of a decent candle from the 1hr chart and leave my target open.


What else could happen?
Well with price going sidways the eur.usd could retrace down. Then its a case of me observing price action for the next while. The next possible buying oppertunity I might get is when it finishes retracing and starts moving back above the 5 min sma as long as everything else on the 4hr and 1hr chart is staying within the "rules".


Cheers,

Andy
 

Attachments

  • 4hr.jpg
    4hr.jpg
    106.7 KB · Views: 197
  • 1hr.jpg
    1hr.jpg
    127.1 KB · Views: 202
  • 5min.jpg
    5min.jpg
    121.3 KB · Views: 199
"busy trading hours" CC could you specify this time interval in a European sense, please? for eur/usd of corse
 
Hi, Blancspa ,

Just think what markets are associated with this currecny pair.
EUR/USD

EUR=European Trading hours
USD= American Trading hours

Busiest time is when both are open.

and after market sessions on the euor markets.
 
I think the Cap'n specifies 7am-4pm in his good book, but I'd be interested to hear what he says on this because elsewhere, I have been advised 7-11am, 1.30-4pm and 7-9.30pm (all UK time which is currently GMT+1) As always, be wary of news, etc ;-)

Andy ... ?
 
I think the Cap'n specifies 7am-4pm in his good book, but I'd be interested to hear what he says on this because elsewhere, I have been advised 7-11am, 1.30-4pm and 7-9.30pm (all UK time which is currently GMT+1) As always, be wary of news, etc ;-)

Andy ... ?


Reler .....? :)

London trading times 7am-4pm are a good guide for me but I have seen some great setups at 6:35am and even 7:27pm .......


Andy
 
Posted Today at 12:46pm
My thinking on this is:
Would I buy it today if it broke 1.3838? Probaby would if we where still during busy trading hours. Stop loss could be 30 pips away and hoping to pic up 2.1 - 1.5.1 risk v reward or if I really thought eur.usd could go a lot higher I might put my stop loss under the low of a decent candle from the 1hr chart and leave my target open.

Cheers,

Andy


Can I bend my "busy trading hours" quote?
If it walks like a duck and quacks like a duck, its a duck.
60 pips reward for a 30 pip risk but I knew what I was looking for and I waited all day for it ;)

Andy
 

Attachments

  • eurtrade21.5.09.jpg
    eurtrade21.5.09.jpg
    102.8 KB · Views: 176
Just was wondering if I registered for free charts from metatrader how long does it last....
...is there a expire date, so i can only use the charts for 30,40 days?
 
CC... out of interest, on the last trade you put up, why did you go for that specific high? There was one closer (at c. 15:45; 1.3788) which satisfied the 3 ducks?
 
because the previous high was 1.3836, and in his pdf you have: watch out for the previous highest high, if you didnt read it yet, go back, someone posted that pdf before
 
CC... out of interest, on the last trade you put up, why did you go for that specific high? There was one closer (at c. 15:45; 1.3788) which satisfied the 3 ducks?


Hello of07923,

We spoke about this yesterday, go back to post number 821 and have a read through mate.


Andy
 
because the previous high was 1.3836, and in his pdf you have: watch out for the previous highest high, if you didnt read it yet, go back, someone posted that pdf before


Hello Blancspa,

I dont think I ever said that in my ebook :sneaky: :sneaky: :sneaky: Are you getting mixed up with something else?

I know what of0 was asking and I think if he reads back on what we wrote yesterday he will be clearier to why I entered where I did (y)


Andy
 
Hello Blancspa,

I dont think I ever said that in my ebook :sneaky: :sneaky: :sneaky: Are you getting mixed up with something else?

I know what of0 was asking and I think if he reads back on what we wrote yesterday he will be clearier to why I entered where I did (y)


Andy

implicitly
anyway as you said we talked about it yesterday,

I thought you enter the trade above the 60 MA and the previous high
 
Top