3 Duck's system confusion (yeah, I know...)

RealSavoy

Newbie
Messages
6
Likes
0
Hello,

I am on step 1 of the 3 Duck's Trading System. Step 1 says "4HR chart, above 60 SMA = Move on to step 2...

I did a 4HR chart with a 60 period SMA
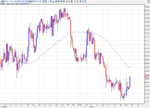

60 period sma.PNG


1. How do I know when the SMA has reached 60 or above?
2. What should be my date range for the 60 sma? 1 day, 7 days, 14 days, 30 days?
3. If 7 days should I be trading every 7 days (seems weird)?
4. Do your answers apply to step 2 and 3 as well?
5. Am I missing an important part in this?!

Thank you,

RealSavoy
 
I have no idea what this system is about, but with what you've given, I'll try to take a stab:

1) They aren't talking about the SMA reaching 60 or above. They are talking about the instrument's price going above the 60-period SMA.

2) Use the date range provided by the system - the 4 hour chart. Every time frame will give you a different 60SMA, but the system says to plot it on the four-hour chart. You'll most likely have to put it in minutes - so, for the 4-hour, it's going to be 4 x 60 = 240.

3) No clue what you're asking here. The time frame for question two doesn't tell you how much you should be trading, but it's just a time interval for the chart.

4) Now I seriously doubt you know what you're doing. I really don't know what you're asking.

5) Yes.

I hope you're not going to be trading with real money...I suggest you grasp a fundamental knowledge of how charts work and then begin paper trading.
 
Hello,

I am on step 1 of the 3 Duck's Trading System. Step 1 says "4HR chart, above 60 SMA = Move on to step 2...

I did a 4HR chart with a 60 period SMA


View attachment 116052


1. How do I know when the SMA has reached 60 or above?
2. What should be my date range for the 60 sma? 1 day, 7 days, 14 days, 30 days?
3. If 7 days should I be trading every 7 days (seems weird)?
4. Do your answers apply to step 2 and 3 as well?
5. Am I missing an important part in this?!

Thank you,

RealSavoy


Don't bother matey. Everyday, open one of these f*kas.

untitled.png

This can is the ordinary stuff. If you go to Holland and Barrett you can get special market stuff. Noks spots off the 3 duks.
 
Amit,

Thank you for your honesty and critique, it get's me closer to where I want to be.

With a little research I answered my own questions...

1. 60 periods would = 60 seperates moves (up, down, sideways) the last period would have to be above the sma line (keep me honest experts).

2. I discovered that my range was already described in step 1,2 and 3

3. That question was just out of left field

4. Another left fielder

5. I think I might have this covered

I am trading paper money and will be doing backtesting to ensure I am doing it right.

Kimo'sabby I have no idea what youre talking about, but thanks for your attempt...
 
yeh, no moving average has a 'timeframe', i.e. '60sma for last 5 days' it's just a line calculating the average of the last X bars , the number of bars you see depends on the timeframe, 60 minute chart forms a bar every 60 minutes, 36 minute bar forms one every 36 minutes etc. 'above' the 60 sma ' just means for price to literally be above the 60sma, in your OP the price is below it :)
 
Thanks! I've been looking at it all day, USD/JPY has been struggling... I'll backtest put's and see if it would make sense to try the system backwards/upside down
 
Top