You are using an out of date browser. It may not display this or other websites correctly.
You should upgrade or use an alternative browser.
You should upgrade or use an alternative browser.
Best Thread The 3 Duck's Trading System
- Thread starter Captain Currency
- Start date
- Watchers 259
Don, yes that is a good one to look at. You might also want to look at the GBP/JPY and EUR/JPY. Both are profitting really well right now.
I'm too old to follow more than one.🙂
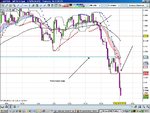
It is also useful to watch yesterday's daily close when trading the 3 ducks.
See attached. Caught 13 pips on that just now. Should have got more but I frighten easy.
Attachments
hey champ is there a popular currency pair that like say quack quack more than other pairs.
I like your system its simple and straight forward,very low stress system,have or are you looking at any potential improvements or adjustments or are you happy as it is
happy trading
I like your system its simple and straight forward,very low stress system,have or are you looking at any potential improvements or adjustments or are you happy as it is
happy trading
Hey DonR, I did in fact see that trade too, but i chose not to trade it because it was going across 3pm GMT (News time for USD). Fortunately it continued to go the right way for you.
Thanks all for your help/input.
Mikey
Do you know, I saw that it was non farm payroll day this morning in my Outlook calendar but completely forgot about it by the afternoon.
You were very wise not to. I've been caught like that myself and it hurt!
That non farm payroll report is today. So no trading for me then. A day off.
Hey, new to the forum and been reading alot here. Very intresting stuff!
Im currently a newbie to trading and have been doing alot of research for a few weeks now and have given forex trading a shot on a demo account with metatrader4. This is my first strategy that i am using so i got a couple of questions for you lot.
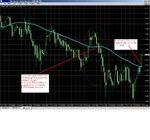
What exactly is 60sma? It is simple moving average but what is the '60'? What are yous measuring?
I have got 3 graphs open, 4h 1h and 5m on GBPUSD. The bit im not sure if im following correctly / understanding is 60sma.
In the graph i have attached, The red circle is where i have some questions to ask. Do you always wait for the indicator to cross threw the prices and when the prices are coming down and the indicator crosses, is that when you would purchase a sell price? In my graph, if i was following what i think 60sma is, i would be purchasing a sell price at 1.7491?
Just a quick question, i have read a few places about what pips is but i seem to read a different measurement ,when you say pips is that as if you bought at 1.57 and sold it 1.67 = 10pips?
PS. Sorry about the wording, im still trying to remeber the jargon
Im currently a newbie to trading and have been doing alot of research for a few weeks now and have given forex trading a shot on a demo account with metatrader4. This is my first strategy that i am using so i got a couple of questions for you lot.
What exactly is 60sma? It is simple moving average but what is the '60'? What are yous measuring?
I have got 3 graphs open, 4h 1h and 5m on GBPUSD. The bit im not sure if im following correctly / understanding is 60sma.
In the graph i have attached, The red circle is where i have some questions to ask. Do you always wait for the indicator to cross threw the prices and when the prices are coming down and the indicator crosses, is that when you would purchase a sell price? In my graph, if i was following what i think 60sma is, i would be purchasing a sell price at 1.7491?
Just a quick question, i have read a few places about what pips is but i seem to read a different measurement ,when you say pips is that as if you bought at 1.57 and sold it 1.67 = 10pips?
PS. Sorry about the wording, im still trying to remeber the jargon
Attachments
Hey guys just trying to follow the 3 duck system (very late though) as it looked very simple from outside but finding it bit difficult to understand the entry points. I understand that I need to look in the order of 4hour time frame first and then 1hr and 5min chart, so say eur/gbp is trading well below the 60sma on all the 4 and 1 hour TF´s but when I look at 5min the prices are swinging very close to the 60sma (mostly below) although I can see that the trend is negetive and if I would have entered (shorted )at around 4pm on 1st oct 08 then I would be in good profit now. (I missed it!!)
So my point/question, Is it just one time entry when larger TF gives confirmation and wait for the 5min to cross the 5sma in the direction of other TFs?? I mean can I also sell the EUR/GBP now whenver prices comes down the 60SMA and breaks previous pivot low etc on 5MIN chart for confirmation??(BTW I am not really intersted in scalping trades) Or should I just ignore it as my entry would not be much profitable and hunt for other pairs who are begining to form 3ducks??
I am sorry if this question has already been answered and thank you for your valuable time.
Looks great and simple. No complicated indicators with charts overflowing with indicators.
Tenapenny
Experienced member
- Messages
- 1,005
- Likes
- 46
Hey, new to the forum and been reading alot here. Very intresting stuff!
Im currently a newbie to trading and have been doing alot of research for a few weeks now and have given forex trading a shot on a demo account with metatrader4. This is my first strategy that i am using so i got a couple of questions for you lot.
What exactly is 60sma? It is simple moving average but what is the '60'? What are yous measuring?
I have got 3 graphs open, 4h 1h and 5m on GBPUSD. The bit im not sure if im following correctly / understanding is 60sma.
In the graph i have attached, The red circle is where i have some questions to ask. Do you always wait for the indicator to cross threw the prices and when the prices are coming down and the indicator crosses, is that when you would purchase a sell price? In my graph, if i was following what i think 60sma is, i would be purchasing a sell price at 1.7491?
Just a quick question, i have read a few places about what pips is but i seem to read a different measurement ,when you say pips is that as if you bought at 1.57 and sold it 1.67 = 10pips?
PS. Sorry about the wording, im still trying to remeber the jargon
The '60' in 60sma is the number of periods the average is calculated over, i.e. 60 periods. This link might help. Moving Averages - StockCharts.com
The pips you mention are normally quoted to 4 places, e.g. 1.5700 to 1.6700, so in your example it would actually be 1,000 pips.
Hope this helps.
Thanks for the reply Tenapenny, I understand the pips now ehehe
That link helped a bunch pal. Thanks for that, i understand how sma is calculated! Progress!
Would 60sma be 60 periods as in each period is 5 mins in this strategy?
Yeah. IT would. On the 4 hour chart each period will be 4 hours.Same for all timeframes
Hi All,
After trying many things out and testing loads of systems, i finally managing to put one together based on this simple approach. It is great the it can put you so easily to the right spot if you check out support and resistance areas. Waiting for the break of the last high/low is eliminate so many false trades.
I am demo trading it for two months now and after taking care of setting realistic targets and stops based on s&r levels, the difference is striking. Also in the first month i tested it mainly after hours as my other commitments didn't let me monitor the market between 7am and 4pm. I am using the indicator and template set available with an overnight range high and low indicator which also helpful to see support and resistance in the morning.
I find this mostly capture the first big move mostly in the morning then better leave it for the rest of the day. Looking back to these morning opportunities they are usually the breakout from the overnight range and very swift moves.
Is anyone still using/ trading 3Ducks here? I would be interested how other people manages their trades with this system.
regards,
Viktor
RedCabbage
Junior member
- Messages
- 21
- Likes
- 0
Hi Viktor
I am currently integrating 3 Ducks into my existing strategy as one focuses on confirming direction and the other changes in direction.
I will report back on how it performs in the current climate.
I am currently integrating 3 Ducks into my existing strategy as one focuses on confirming direction and the other changes in direction.
I will report back on how it performs in the current climate.
Hi Viktor
I am currently integrating 3 Ducks into my existing strategy as one focuses on confirming direction and the other changes in direction.
I will report back on how it performs in the current climate.
Great, looking forward to your success🙂
Let us know how you get on.
RedCabbage
Junior member
- Messages
- 21
- Likes
- 0
A nice 65 pips on cable from 12pm today.
N.B. This position and risk reward ratio was confirmed by some of my main strategy indicators. It hit it's target comfortably before the US news releases at 13:30GMT.
N.B. This position and risk reward ratio was confirmed by some of my main strategy indicators. It hit it's target comfortably before the US news releases at 13:30GMT.
montmorencyt2w
Senior member
- Messages
- 2,619
- Likes
- 294
I know this system works better for some pairs than others. Does anyone happen to know how it behaves for EUR/GBP?
(Hope to be trying it myself in due course, but forwarned is forearmed.)
Thanks,
M.
(Hope to be trying it myself in due course, but forwarned is forearmed.)
Thanks,
M.
Similar threads
- Replies
- 11
- Views
- 4K