Swing and Position Trading

Hi split

Other extensions are ok (the list of valid extensions sits over the manage attachments button) but .gif is good because it uses less bytes than most and loads more quickly. A disadvanatage - unless you use a good converter - is some loss of definition.

good trading

jon
 
Hi,
I'm new to this board and to stock trading.
I would like to know how you select stocks to swing trade.
Do you select from the ftse100 or do have favourite stocks you trade continuously?

Thanks
DonR
 
DonR said:
Hi,

Do you select from the ftse100 or do have favourite stocks you trade continuously?

Thanks
DonR

Hi Don - welcome to T2W

For me it's a combination of both. If you're completely new to this do some trawling through the boards - there's a lot of good stuff.

good trading

jon
 
the chart is good .what is the moving average?

thanks for the simple chart. it is beautiful.
for a novice like me,i try tobreak the process into small steps.please correct me if i went wrong anywhere.

in the middle of confusion,there is a simple way out-easy and tension free.
sequence is as follows
objective
catch good swings and lock profits on slow and steady basis
tools needed
daily bar chart, moving average,stoploss, a decent swing of plus or minus 10%
Enter on a swing low,preferably at the beginning of a new trend,with a price rise possibility. use 1-2-3 signals? start with a break even stop and maximise profits.
look for trend change when a higher high forms as confirmation.
the question is how do I choose this moving average or it is a fixed simple or exponetial moving average? please guide me on this.
i cant figure out what moving average is used in the chart.
if i use a wrong moving average,i may not be able to figure out trend.

kindly let me know whichg moving avg you have used on the chart.
regards
ramesh151


barjon said:
techst

ok - first hg.

Trend changed to up after moving above the high of the earlier swing high bar. The first swing low was iffy because it was lower low so I ignored. The second swing low (continuation) looked ok so I entered long @ 270. The third swing low came a bit early for my taste and is now being tested (not yet closed below it) so things look doubtful. I have a b/e stop in which has not been triggered yet.
 
ramesh151. if i use a wrong moving average said:
I haven't seen the ma to which you are referring but my take on them is that they are all based on historical readings and are better left alone when attempting a reversal, although useful for spotting entry points in a strong and established trend. I am following dbphoenix's price+volume thread-trying to, that is, because I feel that indicatorless charting gives more up-to-date information with less clutter. The trouble is that P+V is damned difficult, too, but it is more logical, IMO. I'm hoping to get to the bottom of it before retirement day :LOL:

Have you tried candle charts, which give a good idea of how the day closes with regard to previous closes, how much the price has moved up and down with how much volume?

The extract from your post says it all. The question is, which time length do I use in a trend? I suggest that we all wished that we had used another timeframe after the event and that there is always one that which would have made us money if we had used it!

As always Good Luck and keep at it!

Split
 
ramesh151 said:
thanks for the simple chart. it is beautiful.
for a novice like me,i try tobreak the process into small steps.please correct me if i went wrong anywhere.

in the middle of confusion,there is a simple way out-easy and tension free.
sequence is as follows
objective
catch good swings and lock profits on slow and steady basis
tools needed
daily bar chart, moving average,stoploss, a decent swing of plus or minus 10%
Enter on a swing low,preferably at the beginning of a new trend,with a price rise possibility. use 1-2-3 signals? start with a break even stop and maximise profits.
look for trend change when a higher high forms as confirmation.
the question is how do I choose this moving average or it is a fixed simple or exponetial moving average? please guide me on this.
i cant figure out what moving average is used in the chart.
if i use a wrong moving average,i may not be able to figure out trend.

kindly let me know whichg moving avg you have used on the chart.
regards
ramesh151

ramesh

I think you're refering to the hg chart posted early on in the thread. It may look beautiful but see what happened next where it became ugly before it went to the beauty parlour and smartened itself up again :)

If you are inexperienced it's dangerous just to leap in without a lot of preparatory work. DBPhoenix has set out a really good series of questions you might like to consider
http://www.trade2win.com/boards/showthread.php?t=15886 and there's also a good article about building a Trading plan in the Knowledge Lab.

Putting that into the context of you questions, you need to define good swing; swing low; trend change etc etc.

As an example the moving average does not define the trend for me, it is merely a conditional subsidiary that influences my position size. - it's 15day simple by the way.

Hope this helps.

jon
 
Hi all
SCHN has been doing some nice swings over the last few weeks if anyones interested!!

Millsy
 
BAA Position Trade

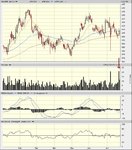
I do feel that I should post the odd chart on this thread occasionally. And prehaps kick start something on a thread that's been popular. BAA, own some airports. Which in the face of recent terrorist activity doesn't sound too inviting. But there is some plus side to this stock. In terms of my fundamental filters it looks pretty good. Price earnings growth (PEG) below 1. A dividend above 4%. A low P/E. Earnings per share which are going up not down. I use these filters as I believe institutional players in the stock market will be looking for value as people go back to basics after the speculative craziness of the internet bubble. I also believe 2005 to be a good year to be long.

As Technical Analysis goes the volume 2 bars ago as in Thursday is massive. I also checked what ratio of buys to sells this volume was. It's 10/1 on the long side. So people are accumulating this at this level. 600 being the support and a close above 610 would certainly tempt me in for my position trading style.

Thanks for reading. Any thoughts guys please share...
 

Attachments

  • baa.JPG
    baa.JPG
    108.5 KB · Views: 398
how about United Utilities (UU.) - looks good.

Hi Techst@,

Personally - I would be cautious to enter long on BAA, (myself I'd give it a miss), - I tend to work on TA only, maybe I should start looking at the fundamentals as well.

One that has caught my eye is UU.

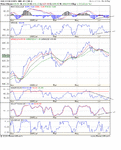
Have a look at the attached chart for United Utilities (daily)- (on the weekly trading range it's near the lower limits) and there looks to be some fairly strong indicator divergences on the daily , I think it's nearly time for it to head upwards, haven't checked any fundamentals, ( can you have a look, see what you think),

All comments welcome.

Rex
 

Attachments

  • United utilities UP.gif
    United utilities UP.gif
    37.7 KB · Views: 344
That's funny I'm not keen on your one. I think BAA may need somemore time, But it's not printing lower lows which UU is. In Dow Theory lower lows define a downtrend. UU has printed a lower low and has broken an upward trendline. Although corrections can come in 3 waves (elliot wave) which this does show. I'd be waiting for a two day close above 650 on UU. Or a one day close above with high volume.

Your also using 4 oscilators! Make sure your not just taking the signals of oscilators you like to back your decision. WR, RSI,Stoch and Stoch RSI are all pretty much the same. Out of those i'd pay attentionto the RSI, looking for divergences that are confirmed by the MACD. And also looking for extreme readings of the RSI, hence your RSI with Area use. This can be useful to spot potential tops and bottoms. But be sure to use price and 1-2-3 reversals to confirm these tops/bottoms. I personally have had very limited success using MACD Histogram on a daily chart to confirm changes in the trend. Actual MACD line divergence is much more important. For example, look at your UU chart and the upward move that started around October time and finished off at the end of Feb. Notice the moving average lines of the MACD actually diverge. This is a much stronger signal than a histogram divergence. Not only that but it was also confirmed by the RSI. I would want to see some serious strength to confirm that this is not just a countertrend upward move in a downtrend. Thanks for posting the chart, keep your views on the UK market coming. Thanks for reading.
 
United util's weekly

hi techst@,

Apreciate your comments - I don't really take notice of the daily MACD histogram on daily charts, but I do use it on the weekly charts,

I use the macd histogram on weekly charts when it's at an high or low, I then wait for it to tick up / down, and at that point I look for my entry on the daily. The macd histogram changes before the macd lines converge giving me the best entry opportunity that I know of.

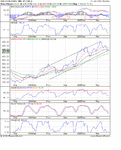
Have a look at the weekly chart attached for UU., the MACD histo ticks up just before a rise.
- also I think UU. is roughly at the bottom of it's trading range.

I am a bit premature on highlighting UU. as a long, but once the MACD histo ticks up, I will enter using 2 indicators on a daily chart (looking for oversold).


I'll let you know how it goes -

Rex
 

Attachments

  • united utilities weekly.gif
    united utilities weekly.gif
    35.4 KB · Views: 321
Just a word of warning. The weekly MACD is showing negative divergence, possibly indicating a further move down or reversal. Do you trade short REX? And if you don't take take notice of a daily histogram, why did you put a line underneath it? Also your low trendline on the weekly doesn't touch three points, appartently that makes it invaild. Not my rules, just general TA classifications.

I tend to sway more to price action on entry rather than indicators. I always wait for the price to confirm what an indicator is printing. Because indiactors are derived from price and not the other way around.

What I found useful in helping me use a MACD was Gerald Appel's (the creator of the MACD) recent work on Supplementary Rules for the MACD. You'll find this chapter in his lastest book Technical Analysis Power Tools for Active Investors. The chapter on the MACD is worth price of the book alone.

Thanks for the interesting discussion Rex, any other charts you wanna stick up? feel free!
 
techst@ said:
Out of those i'd pay attentionto the RSI, looking for divergences that are confirmed by the MACD. And also looking for extreme readings of the RSI, hence your RSI with Area use. This can be useful to spot potential tops and bottoms. But be sure to use price and 1-2-3 reversals to confirm these tops/bottoms.

Hi techst@ and Rex79,

I have been reading the posts between you with interest as I have been expounding, for some time now, using the bar chart without indicators. I would like to include volume but, even with Db's thread, I do not think that I will ever understand it sufficiently enough to be able to trade confidently.

To help me with my forecasting I did some testing, using your undicators, MACD and RSE
and came up with some interesting results. It, also, made me think about techst@'s comments referring to the inclusion of fundamentals in trading.

I hold some ScS Upholstery shares.

This company is a high street retailer and they are in poor repute just now, Even though it has yield of 4.27%, Last earnings growth of 66%, future growth prospects of 15%, ROCE 62.9
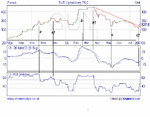
Net gearing -55.6, and a peg of 0.7 (at current price), this company's price has slide from 423p to 305p since the end of March. If you care to look at the results (SUY) on UK Wire you will see that the directors are confident about the future.

This shows that fundamentals do not, necessarily, help a trader. He could have lost a lot over the last four months if he had been long in March and hadn't used stops. But my chart and your indicators would have shown me the warning signs between a and a1; b and b1 and potential rise (?) c and c1.

What do you think?

Split
 

Attachments

  • SCS1.gif
    SCS1.gif
    9.6 KB · Views: 330
hello Split & techst@

I think that studying TA is enough to make rational trading decisions, although I have not yet tried to include fundamentals as part of my screening ( I'm the first to admit I'm relatively new & lacking in the experience dept).

i think my opinion has been formed by the books I've read and the way I've tried to educate myself, maybe if I would have read up on fundamental analysis it would be different, maybe next year it will!

But something I read in John. J Murphy's book on T.A.

"anything that can possibly affect the price - fundamentals, politically, psychologically etc - is actually reflected in the market price. It follows, therefore that a study of price action is all that is required"

" Chart analysts know there are reasons why markets go up or down, but he/she doesn't believe that knowing what those reasons are is necessary in the forecasting process"

No-one's right, no-one's wrong - it's just your opinion.

Cheers
Rex
 
Good discussion guys. In terms of using fundamentals for trading without using technical analysis in my opinion would be like trading with a blind fold on.

When I have 5 stocks that i'm looking to enter and my money management rules will only allow me to enter 2 positions, I'll then use the stocks with the best fundamentals. During market periods after a crash (9/11) people return to value, instead of speculative stocks with nothing going for the company other than the price. Fund/Money managers also return to value and look for stocks with dividends and profits etc. Just making sure the stock has some institutional sponsorship will help me sway me in the direction of that stock if all other things are equal. I just like to be where the action is and i believe it's in value stocks. I'm not bang on the fundamentals, just yesterday i placed a trade on a stock with nothing to show fundamentaly. It's just a health check or filter i might use.
I could post a study or quote about using fundamentals with technical analysis, or how low price high dividends stocks tilt the odds slightly or even a chart or two with fundamentally strong companies with charts going to the moon. But if we want to prove anything in the market there is more than enough examples of charts to back with any wild theories that we dream up. Whether those studies make any difference to a position style trader, who knows! But I'm more than happy with my own personal performance. What's more important is finding what works for you.

Thanks guys
 
techst@ said:
Good discussion guys.

Techst@ can you let me know which fundamentals you filter, I'll have a look at some of my potential picks,


- Have a look at SSE - I entered a buy bet on Friday, (at the bottom of the weekly trading range)and hopefully going up
 
Hey Rex check when i first posted about 'funnymentals' (as Ed Seykota calls them) They should be contained in that post a few pages ago. It's interesting that alot of the companies with ridiculously low p/e's (5or6) are mostly coming out of bear markets. These are perfect opportunities to get into a stock that has started a new bull market. I flagged some previous examples of these quite a few pages back. (CW and BAY) These two stocks have peformed really well since i came across the change from bear to bull markets.

SSE is certainly interesting. The only problem with SSE is the channel that it trades in. I prefer the low priced issues that make it slightly easier to come away with a good profit. On SSE i would be looking for a two day close above 980. Then my first target would be the previous high at around 1020. I'd see how the stock reacts to this area (if i did decide to enter it). Say you weren't sure at this level, and come out with a tidy profit. But ,you would only be making about 4% (from 980 to 1020). Or on a small play of 10K you'd have only £400 to show for your patience and work, forgetting slippage of course. Small priced stock around 100,200,300 level, have channels 10,15,20% wide making profits easier as they swing around more. Chase the fat rabbits not the skinny ones. Best of luck with that one, its looks good if theres some momentum through 980.
 
Morning techst@,

I'm still spread-betting at the minute - so placed a buy on it at 977, (I know - spread-betting's no good, compared to CFD's - I am looking to go that way soon), -

I'll just explain my situation - I check equities in the FTSE 100 at night, only concerned with stocks priced above £9-£10ish - for spread betting i need stocks with plenty of points movement, I use metastock for my charting.
My problem is in the day I work as an engineer and am sitting behind my desk, I can only check prices/charts on MoneyAm.com ( I have restricted internet access ), when I actually place a buy/sell bet, i have to do it using a PDA and mobile phone. (The amount of wasted energy is unbelievable - but I'd rather try the hard way than not at all).

Over the next few weeks I'm hoping to switch to CFD's, then I can at least i can place orders at home in the evening and close them by phone if needed.

( i start building a house soon, so I might have to stop completely),

bit of a laughable way to trade - but am still learning in the process,

Rex
 
Top