You are using an out of date browser. It may not display this or other websites correctly.
You should upgrade or use an alternative browser.
You should upgrade or use an alternative browser.
Second income trader
Member
- Messages
- 74
- Likes
- 0
Thanks Jonny. I take your point re. volatility, is that why Forex seems so popular to trade? Is Forex amenable to Swing Trading using Marcs approach as well?
Cheers, Paul.
Cheers, Paul.
JonnyT said:The FTSE has been virtually untradeable for over a year and the Dow might not be as easy now as the book suggests...
Having been trading indices for the last 4 years, I must say that I'm inclined to agree with Jonny about this, albeit that I don't quite match his succinct and forceful turn of phrase ... the FTSE has certainly been "difficult" for the last year or so, and the Dow is certainly not as easy as the book suggests. I'm increasingly looking to the Dax and the S&P, but also trying to learn new tricks and broaden my trading interests.
CW and BAY
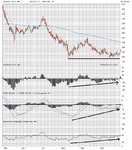
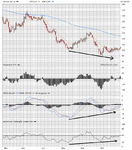
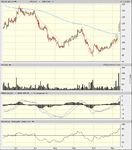
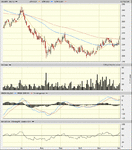
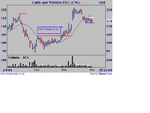
These two stocks are looking great at the moment. It looks like the recent downtrends are running out of steam. The chart shows the strength of the MACD Divergence on both charts. If im not mistaken the weekly MACD's and Histograms are in gear too. Confirming as Elder says ' a more dynamic move'. I dont currently have positions in these stocks but im seriously considering these. And in prehaps a day or two i'll pull the trigger. Any thoughts people? I might even turn these two into a live and up dated 'anatomy of a trade' if i get any interest. Hopefully some viewers will come out of the woodwork and discuss there views on these.
These two stocks are looking great at the moment. It looks like the recent downtrends are running out of steam. The chart shows the strength of the MACD Divergence on both charts. If im not mistaken the weekly MACD's and Histograms are in gear too. Confirming as Elder says ' a more dynamic move'. I dont currently have positions in these stocks but im seriously considering these. And in prehaps a day or two i'll pull the trigger. Any thoughts people? I might even turn these two into a live and up dated 'anatomy of a trade' if i get any interest. Hopefully some viewers will come out of the woodwork and discuss there views on these.
Attachments
techst@ said:These two stocks are looking great at the moment. It looks like the recent downtrends are running out of steam. The chart shows the strength of the MACD Divergence on both charts. If im not mistaken the weekly MACD's and Histograms are in gear too. Confirming as Elder says ' a more dynamic move'. I dont currently have positions in these stocks but im seriously considering these. And in prehaps a day or two i'll pull the trigger. Any thoughts people? I might even turn these two into a live and up dated 'anatomy of a trade' if i get any interest. Hopefully some viewers will come out of the woodwork and discuss there views on these.
Emerging carefully from the woodwork and with the usual caveats I venture the following.
I am not a devotee of indicators so I cannot comment on the MACD'S etc. My interest is price/volume in which I am slowly gaining more knowledge.
I have looked at the charts for both of these companies (British Airways and Cable & Wireless) and am struck by their similarities. Lower lows and lower highs both appear to have found support BAY at 200 & CW at 100. Appear is the operative word. I am not convinced that the support will hold. I would want to see them moving up on reasonable volume before I purchased.
A look at the 2 year charts for these companies illustrates the levels they can fall to.
I look forward to reading other views
Regards
bracke
techst@ said:These two stocks are looking great at the moment. It looks like the recent downtrends are running out of steam. The chart shows the strength of the MACD Divergence on both charts. If im not mistaken the weekly MACD's and Histograms are in gear too. Confirming as Elder says ' a more dynamic move'. I dont currently have positions in these stocks but im seriously considering these. And in prehaps a day or two i'll pull the trigger. Any thoughts people? I might even turn these two into a live and up dated 'anatomy of a trade' if i get any interest. Hopefully some viewers will come out of the woodwork and discuss there views on these.
looking good - maybe a retest of the TL from above before they finally rally. Didn´t like the last candle (BAY) so no hurry I guess. Otherwise they should have found their bottoms.
CW and BAY
Just updating this thread with the current unfoldings of the two charts i posted. I've been in and out of BAY. I got in at a terrible price as i traded by phone mid-day and didnt have the use of a chart for the days candlestick. I then exited at 27.25 making a 5% profit, or 50% profit but that depends how you look at it with the CFD leverage. I was trading other stocks and aswell and i may have been over exposed if i'd added another position in CW, damn money management! I'll post some other great moves that may unfold in the near future, if theres an interest. Some might fell that its not a great idea to show others your setup and strategy but i think whats more important is the way you handle your own stragegy. any thoughts?
Just updating this thread with the current unfoldings of the two charts i posted. I've been in and out of BAY. I got in at a terrible price as i traded by phone mid-day and didnt have the use of a chart for the days candlestick. I then exited at 27.25 making a 5% profit, or 50% profit but that depends how you look at it with the CFD leverage. I was trading other stocks and aswell and i may have been over exposed if i'd added another position in CW, damn money management! I'll post some other great moves that may unfold in the near future, if theres an interest. Some might fell that its not a great idea to show others your setup and strategy but i think whats more important is the way you handle your own stragegy. any thoughts?
Attachments
My greatest concern about swing trading individual shares is the relative lack of volatility and the huge spreads quotes by SB cos. You're using CFDs so maybe this is not such an issue. If you are still trading using (Elder) type methods then then should be manu similarities in our styles - I would be interested to see posts describing your trades should you be good enough to post 'em.
Cheers
FN
Cheers
FN
Fastnet, i got in BAY on the 28/10/04 (see the graph style chart above). And was out 5/11/04 and out at 227.5 which was the high for the day. I was lucky enough to have the evening free to watch the intraday action to time my exit well. I make sure the stocks i trade have a minimum of 8 to 10% swing in there price move, from channel to channel. I do take into account that I'm not gonna get in at the very bottom and out get out at the highest price in the channel, that would be wishful thinking. Some people wonder why the trades that they dont put on do well, but i know thats coz im looking at where i would have like to of got in and where the perfect sell point was. I dont see the huge spreads you mentioned as the company i use try to match the market. I like mainly FTSE100 companies coz there liquid.
Hi Folks,
This is my first post as a newb on the swing trading scene. Im wondering if you guys can share any systems or TA techniques you find work well?. Im thinking of using a combo of S/R levels, MACD and CCI. Any thoughts?
Also any chance of posting potential trades and the reasons why, regularly?
Cheers
P.S. being a newb sucks 😱
CW and BAY (again)
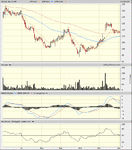
Another update on these charts provide some good viewing. After the leg upward shown on previous posts these two now provide opportunities to enter on the current retracement. BAY has already started its next move upward and trading from here and getting a good price on entry maybe be tricky. Although hiding yourself in and trading in the next bearish candle might be an idea, but i'll see how these this pans out. CW has retraced nicely and getting back in looks like a good idea. I'll be waiting for some strength before that happens but a bullish engulfing or piercing candle with some good volume would be ideal. Mark Rivalland talks about these buy signals in the latest investors cron. Calling them linear phase signal being some of the best times to trade, which pop up once or twice a year. And although his lenses are different (P+F charting) the ideas are the same.
Another update on these charts provide some good viewing. After the leg upward shown on previous posts these two now provide opportunities to enter on the current retracement. BAY has already started its next move upward and trading from here and getting a good price on entry maybe be tricky. Although hiding yourself in and trading in the next bearish candle might be an idea, but i'll see how these this pans out. CW has retraced nicely and getting back in looks like a good idea. I'll be waiting for some strength before that happens but a bullish engulfing or piercing candle with some good volume would be ideal. Mark Rivalland talks about these buy signals in the latest investors cron. Calling them linear phase signal being some of the best times to trade, which pop up once or twice a year. And although his lenses are different (P+F charting) the ideas are the same.
Attachments
barjon
Legendary member
- Messages
- 10,752
- Likes
- 1,863
techst
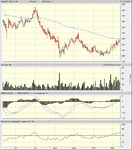
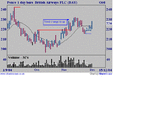
The same two from a slightly different perspective but in accord with your summation. BAY already given long signal (close above white line) and CW poised to do so.
edit: oops, just noticed trend change for BAY could be said to be a bit lower around 215 - swing pullback the same tho'. Sorry for that, these two aren't in my stable 😱
jon
Attachments
Last edited:
roguetrader
Senior member
- Messages
- 2,062
- Likes
- 49
Forgive my ignorance, I am not a swing trader, but why does a close above the white line give a buy signal? On Bay that is.barjon said:techst
The same two from a slightly different perspective but in accord with your summation. BAY already given long signal (close above white line) and CW poised to do so.
jon
roguetrader, from barjon's view (and please correct me if i'm mistaken barjon) this is some short term resistance which lines up with the 220 price level. And i would also use this method before i jumped in. A one day close with good volume or a two day close above the 220. For me, i'd be using my 13EMA moving or ticking upward with a two day close, as shown in my BAY chart. I didn't catch this one,as my money management rules dont allow me to be in every trade available.
roguetrader
Senior member
- Messages
- 2,062
- Likes
- 49
Thanx for your reply techst@, I see the resistance you refer to, just volume looks a little light as it initially breaks that level.. Not trying to pick fault, my own swing trading efforts leave a lot to be desired an am trying to pick up tips and ideas from those of you who trade this style successfully.
Thanx
Thanx
barjon
Legendary member
- Messages
- 10,752
- Likes
- 1,863
rogue trader/techst
The white line is at the high of the swing low bar. I get a buy signal when there is a close above that, which occured 3 bars later and I would have entered the next day (penultimate bar on the chart) if I was trading this one. The more agressive would enter as soon as the price moved above the high of the swing low bar (that white line) which occured the next day.
jon
roguetrader
Senior member
- Messages
- 2,062
- Likes
- 49
Thanx guys I appreciate your input.
Similar threads
- Replies
- 2
- Views
- 4K
M
- Replies
- 3
- Views
- 13K

