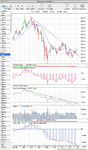
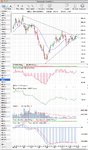
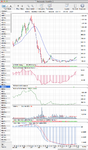
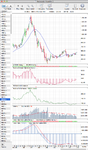
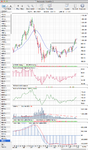
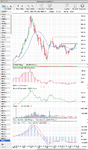
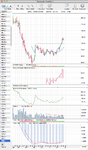
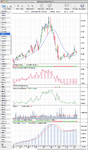
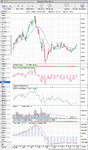
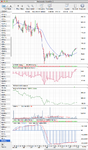
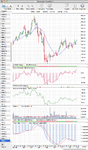
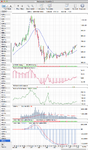
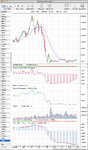
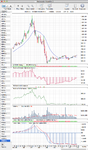
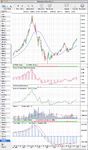
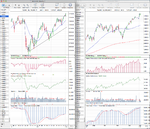
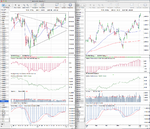
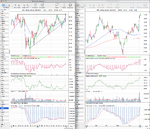
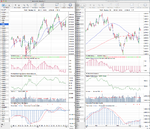
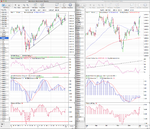
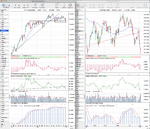
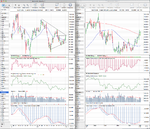
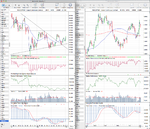
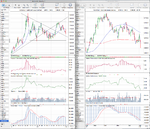
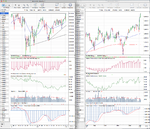
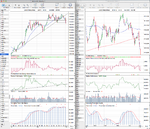
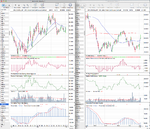
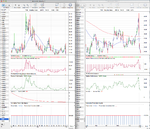
For the trendline drawn as Weinstein suggested in the technically speaking interview, it comes in at around the $29 level. But a bit a lower if you use the weekly closing data like I prefer. But I've attached the chart using the ultimate lows for you. A few things to remember with Silver. It has a strong correlation with Gold, over 90%, so always watch Gold when trading Silver as it's support and resistance levels will affect Silver too. The overnight move in the Gold (GC) and Silver (SI) futures has given them a potential continuation move in their early Stage 4 declines. However, Non Farm Payrolls is today and comes out when the Gold/Silver pit session begins (13.30pm GMT, 8.30am EST) and so it's not wise to do anything before that's been absorbed by the market imo, as they have volatile sessions on NFP days.
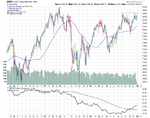
I know you are already in the Silver trade, so I'll just repeat what I said before, which is that although short term Silver and Gold are in Stage 4, they are both still within a much larger Stage 3 / 1 range and are approaching strong near term horizontal resistance which has held multiple times. So just be aware of where the support levels are.
As lplate said, to talk in more detail and actively about it with Silver and Gold day traders there's some good side threads like:
http://www.trade2win.com/boards/commodities/124202-silver-27.html#post2039380 and
http://www.trade2win.com/boards/commodities/164370-gold-2013-lack-lustre-year.html#post2046544 and member YouAreNotFree is the active Silver day trader on the boards that knows the market well imo.