Stan Weinstein's Stage Analysis

Stage 2 "Single Digit Midgets" as Stan describes the low priced Stage 2 stocks. There is a theme the telecom & coal stocks are showing extraordinary strength as the markets have been trading in a range moving towards fiscal cliff.

With China Reflation Coal stocks seems to be coming to life. Very early stage 2 or perhaps late stage 1 with extraordinary accumulation evidence

ANR, ACI & LLEN all coal stocks

(disclosure I am long all these charts currently)
 

Attachments

  • ACI.jpg
    ACI.jpg
    237.2 KB · Views: 425
  • ANR.jpg
    ANR.jpg
    241 KB · Views: 359
  • GMO.jpg
    GMO.jpg
    256 KB · Views: 348
  • GNW.jpg
    GNW.jpg
    239.8 KB · Views: 356
  • GSS.jpg
    GSS.jpg
    252.4 KB · Views: 362
  • VG.jpg
    VG.jpg
    246.2 KB · Views: 656
  • SLT.jpg
    SLT.jpg
    236.3 KB · Views: 338
  • RFMD.jpg
    RFMD.jpg
    271.8 KB · Views: 416
  • NOK.jpg
    NOK.jpg
    241 KB · Views: 354
  • LLEN.jpg
    LLEN.jpg
    240.1 KB · Views: 390
Stage 2 "Single Digit Midgets" as Stan describes the low priced Stage 2 stocks. There is a theme the telecom & coal stocks are showing extraordinary strength as the markets have been trading in a range moving towards fiscal cliff.

With China Reflation Coal stocks seems to be coming to life. Very early stage 2 or perhaps late stage 1 with extraordinary accumulation evidence

ANR, ACI & LLEN all coal stocks

(disclosure I am long all these charts currently)

Hi Rewardz, great work on posting up all of your Weinstein trades. I won't comment on any of them specifically other than the stages for the three coal stocks, which are all still in Stage 1 imo (Basing Phase - may begin accumulation). But the exact stage isn't crucial, what's more important is that if you are going long that it's in Stage 1 or 2 - which your picks are; and if your are going short, that the stocks are in Stages 3 or 4 - which again your short picks are. So is looking good.

What I think would be interesting for myself and others reading the thread - if you are willing - is to get more insight into your thinking behind some of the trades, based on the method of course. i.e. are they picks for the trading method or the investing method? Which ones do you consider the strongest picks (A trade candidates), and which do you consider the weakest picks (C trade candidates). Have the 30 week MA's stabilised, or are they still rising or falling? What resistance are you likely to run into. Are you using the swing target method to calculate your price targets or a different method? Are you weighted more short than long with your picks, or visa versa, or have you position sized to be fairly neutral etc?

So a bit more depth behind some of your thinking with the stocks you've bought based on the components of the method. Of course you don't have to; but I think it could help you and others reading the thread as well. As it's important to journal why you bought a stock and have a plan for each trade so that you don't get shaken out by the everyday market noise.
 
Last edited:
I agree that the numerous indicators are probably to impress his clients, but one indicator that was part of his call though and is talked about over a number of pages in the book is the Momentum Index (MI) which is the 200 day moving average of the Advance Decline line which I've attached.

Isatrader: thankyou for your massive contribution to this thread, which I have enjoyed reading for some time.

I am trying to replicate the Momentum Index in Sharescope. When you created it in your software, did you use the Advance Decline Line or the Advance Decline Oscillator ? Because the line is an accumulating line, so I can't see how it could ever be minus. The Oscillator however is minus just as much of the time as it is positive.

Could you check exactly what indicator you are plotting the 200MA on please ?

Hi rjay, it's plotted using the 200 day moving average of the one day Advance Decline line figure. This figure is the amount of advancing stocks in the NYSE minus the amount of declining stocks. The unchanged figures are ignored. So for example yesterday the Advances were 1678 and the Decliners were 1341. So the single day figure is 1678 - 1341 = 337. So the momentum index is the 200 day moving average of this figure - which moves between positive and negative on a very regular basis, as if there's more declining stocks than advancing then the figure is negative like on Dec 3rd when the advancers were 1192 and decliners were 1826, so therefore 1192 - 1826 = -634

I was plotting it incorrectly until recently, as I was just using the 200 day Oscillator of the cumulative figure. But now I include both on my momentum chart as you can see on the attached. The first Advance Decline line is the Oscillator (Cumulative AD Line - 200 Day MA) of the cumulative figure and the second Advance Decline Line (red line) is the Momentum Index (which is the 200 day moving average of the single day advance minus the decline figure.

Let me know if that doesn't make sense, or you can find Weinstein's explanation of the calculation on pages 283 to 287 of the book.

Attached is my latest AD chart, on which I've highlighted the two and pasted my software settings onto for you to check against.
 

Attachments

  • SPX_momentum_weekly_10_12_12.png
    SPX_momentum_weekly_10_12_12.png
    122 KB · Views: 471
Last edited:
bought some of these a few weeks ago based on my loose interpretation of weinstein
 

Attachments

  • epol.png
    epol.png
    74.4 KB · Views: 474
US Steel (X) is getting interesting as a last stage 1 moving towards Stage 2 breakout.

The 30 week has flattened out and US Steel has been trading in a channel for the past few months.

Accumulate long using lower end of channel as stop/loss exit.

I like US Steel as the volume spikes have all been evidence of acculation and there is a MASSIVE short interest.

Earnings have been beating street estimates quarter after quarter despite analyst bashing. If China reflates, US Steel should launch into stage 2 bull run.

Happy Trading.
 

Attachments

  • X- US steel.jpg
    X- US steel.jpg
    255.6 KB · Views: 319
  • x-breakout.jpg
    x-breakout.jpg
    87.1 KB · Views: 304
Last edited:
Black Mamba- Just thought I would add my two cents...

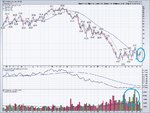
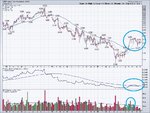
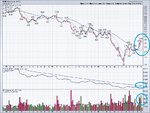
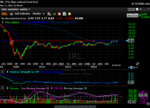
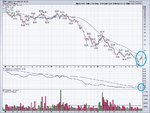
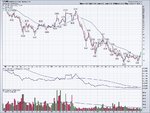
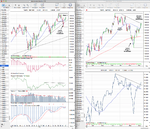
IMO your first emerging ETF, EPOL, is showing mixed signals within the Weinstein method. First the good: 1) The volume has doubled as of recent weeks which shows strong interest. 2) The price is above its 30 week WMA and the current trend looks strong. 3) Its relative performance v SPX is strengthening and although still negative,is showing a buy signal.

Now for the bad: 1) Not sure what your target is but I see two very strong points of resistance at both 30 and 40 bucks. The problem is that the 30 dollar resistance level looks to be extremely strong..it has served as both the support and resistance- So in my opinion, if it did break 30, it would have a fairly easy ride to 40 where you would have some more decisions to make. 2) My second concern is the overall market. If we are in the beginnings of a stage 4 decline as per Weinstein's words in his recent interview, I could not imagine buying into anything at this point until he is confirmed wrong by a strong performance on the major charts, even if it is the Polish Investable ITF.

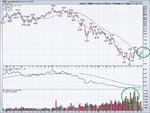
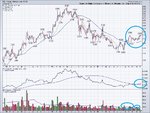
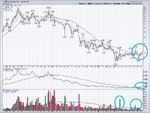
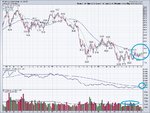
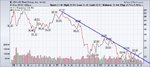
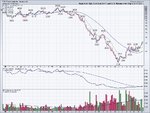
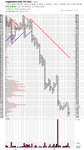
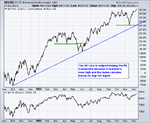
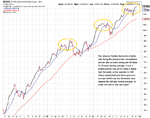
As for the second ETF IRL, I like it more than I do EPOL for a few reasons. 1) Although still seemingly low, the volume has had its stong weeks recently and seems to be gaining in momentum when compared to the last couple of years or so. 2) It is also above its 30 week WMA and its relative strength v SPX is above the 0 line. 3) The strongest reason is that there is no recent overhead resistance. The price crashed in from 07 to 09 and has been in a stage 1 basing phase for a long time. (I know that Weinstein said the bigger the stage 3, the bigger the stage 4...not sure if that logic would also apply to stage 1 moving into stage 2...need to go back and read that) Having just broken the strong resistance level, it looks to be in great shape for a long stage 2 run.

One question, what are your price targets for these two ETFs?
 

Attachments

  • IRL Weekly.JPG
    IRL Weekly.JPG
    92.6 KB · Views: 292
  • EPOL weekly.JPG
    EPOL weekly.JPG
    89.5 KB · Views: 311
Hi rjay, it's plotted using the 200 day moving average of the one day Advance Decline line figure.

That was very helpful and the guys at Sharescope have now coded it and added it to their library.

Do you use a Simple or Weighted MA ?
 
That was very helpful and the guys at Sharescope have now coded it and added it to their library.

Do you use a Simple or Weighted MA ?

For the momentum index it's just a 200 day simple moving average.

On the price charts my preference is to use a 30 week weighted MA, as it's what was used by the Mansfield charts in the examples in the book which I initially learned the stages from. However, Weinstein just uses the simple 30 week MA these days I've found. But personally I find it easier to define the Stages 1 & 3 with the weighted MA. But you can use either and I often look at both.

On the daily chart I use the 50 day simple MA and the 200 day simple MA as used in Weinstein's Global Trend Alert samples I've seen and on the daily chart in the trading section of the book. The combination of the weekly chart and the daily chart MAs is a big part of how I recognise the stages personally, and I've added a small personal addition to definitions recently by considering whether it is a strong or weak breakout based on whether the Stage 2 breakout happens above or below the 200 day MA, and vice versa for the Stage 4 breakdown.
 
Last edited:
locked in thanks
i must admit i don't set targets as the market has a habbit of overextending in either direction. i prefer to put a trailing stop of some sort underneath the price. at mo on EPOL my stop below the 50sma, and on irl 8.30 below recent support.
re the good bad points...to my mind i can't really see the resistence at 30..i have the resistence at 28 which it broken through, but every body sees things differently.
re majour mkts in stage4..from memory his analysis was just on us mkts which agreed do look ropey, but theres always a bull mkt somewhere in the world. its quite possible that us markets have a slump, and european or other markets do well..theres plenty of countries markets doing well at the mo..TUR for one..
im sure in the recent days mr weinstein has altered his shortterm, and maybe medium term view(just a guess looking at charts of dow etc)

I have a similar view to Peter's above in that there's always a bull market somewhere in the world, and although highly correlated to US markets different regions such as Europe and Asia can be in a bull market while the US is in a bear market, as for example long only managers might shift their money to different areas in order to get a better performance. The broad markets are not just risk on / risk off as the TV reporters would like you to believe, but if for example you only trade US stocks, then Weinstein's method means that you should currently be exiting any long term holdings that are in Stages 3 or 4 on the opportunity that this short term rally has provided and moving mostly into cash. And if you trade both long and short, then you'll likely be looking for opportunities in the weakest areas of the US market to get short when we get a new short term sell signal.

Below is a snippet from the last weekly update of the GTA that I was able to see from November 19th.

Nothing that we've seen in the market's action, or in our Weight of the Evidence has caused us to alter our long term bearish view! However, as far as the shorter term outlook is concerned, the overwhelming majority of our trading gauges are now "beyond oversold," and we, therefore, feel that it's quite likely that, from a near term point of view, on Friday (11/16), right before noon, the market registered a short term bottom (which is why we told all of you who called and emailed us that, while we didn't think that you should do aggressive buying, we did feel that it was time to do "trimming" in oversold short positions, with an eye toward shorting once again on the next oversold rally)...
Quote from the GTA NOVEMBER 19th, WEEKLY UPDATE


So Weinstein called a short term bottom on the 19th update, but didn't advocate any aggressive buying and instead said that you should be looking for new shorting opportunities from the rally. This and his large emphasis in the previous report that short term was only to be considered a "2" on the Richter scale means that I would doubt he's changed his medium term view that the US market will go lower in the coming months. But that doesn't mean you can't look for long opportunities elsewhere in the world like Peter is doing or in different asset classes either.
 
Last edited:
Solar Sector looks ripe to move from Stage 1 to Stage 2.

Many of the solar stocks are already in strong stage 2 advances (FSLR, WFR, SPWR, SOL)

Entire sector appears to be poised for major breakout.

150 (30 week) has flattened out and relative strength has picked up.

TAN is the etf to play it or many solar names breaking out.

Happy Trading.
 

Attachments

  • tan- NEAR BREAKOUT.jpg
    tan- NEAR BREAKOUT.jpg
    232.8 KB · Views: 386
  • FSLR.jpg
    FSLR.jpg
    225.1 KB · Views: 265
  • WFR.jpg
    WFR.jpg
    227.8 KB · Views: 368
  • RSOL.jpg
    RSOL.jpg
    227.7 KB · Views: 328
  • SWPA.jpg
    SWPA.jpg
    242.2 KB · Views: 321
Last edited:
Solar Sector looks ripe to move from Stage 1 to Stage 2.

Many of the solar stocks are already in strong stage 2 advances (FSLR, WFR, SPWR, SOL)

Entire sector appears to be poised for major breakout.

150 (30 week) has flattened out and relative strength has picked up.

TAN is the etf to play it or many solar names breaking out.

Happy Trading.

Hi Rewardz, I'm going to disagree with some of this one as the solar sector only just entered Stage 1A this week imo (Start of a base - needs much more time). I agree that FSLR is a leader in the sector and broke out into Stage 2A three weeks ago, but WFR is in Stage 1B, SPWR is in Stage 2A, and SOL is in Stage 1A.

I've attached my charts of TAN which show the two year Stage 4 decline. The 30 week weighted MA only made it's first week higher this week, and the sector is still below significant resistance from earlier this year of which you can see on the P&F price by volume that the most volume changed hands around the 17-17.5 level - which it is currently still below. Relative strength is improving, but it's still a very long way below the zero line. So it's still very early days for the sector imo, but you can obviously play the stronger stocks already moving into Stage 2A. But I'd be more cautious personally about the whole sector, as it's only just starting to base again.
 

Attachments

  • SharpChartv05-9.png
    SharpChartv05-9.png
    41.4 KB · Views: 316
  • TAN_Weekly_12_12_12.png
    TAN_Weekly_12_12_12.png
    117.4 KB · Views: 327
Last edited:
Stan's Don't Commandments

I thought it might be useful to put the list up from page 129 of the book of Stan's Don't Commandments as a refresher. They are:

  • Don't buy when the overall market trend is bearish.
  • Don't buy a stock in a negative group.
  • Don't buy a stock below it's 30 week MA.
  • Don't buy a stock that has a declining 30 week MA (even if the stock is above the 30 week MA).
  • No matter how bullish a stock is, don't buy it too late in an advance, when it is far above the ideal entry point.
  • Don't buy a stock that has poor volume characteristics on the breakout. If you bought it because you had a buy-stop order in, sell it quickly.
  • Don't buy a stock showing poor relative strength.
  • Don't buy a stock that has heavy nearby overhead resistance.
  • Don't guess a bottom. What looks like a bargain can turn out to be a very expensive Stage 4 disaster. Instead, buy on breakouts above resistance.
 
I question Stans comments about markets being in stage 4. The interview on financial sense occured after markets broke BELOW their 30 week averages.

To Trade succesfully one must be flexible and listen to the markets.

The 30 week is rising and has NOTflattened out.

The Sp500 and other indexes ave regained their 30 week and closed weekly above. The SP500 continues to make a higher move....Still needs to break to new 52 week highs, but given the action on Europe indexes and China, I would say we saw a false breakdown.

Still hedge with shorts in stage 4, but aggressive about my stage 2 buying.

If SPX goes back UNDER its 150, then its a whole new story......

Happy Trading.
 

Attachments

  • SPX.jpg
    SPX.jpg
    240.4 KB · Views: 318
I question Stans comments about markets being in stage 4. The interview on financial sense occurred after markets broke BELOW their 30 week averages.

To Trade successfully one must be flexible and listen to the markets.

The 30 week is rising and has NOT flattened out.

The Sp500 and other indexes ave regained their 30 week and closed weekly above. The SP500 continues to make a higher move....Still needs to break to new 52 week highs, but given the action on Europe indexes and China, I would say we saw a false breakdown.

Still hedge with shorts in stage 4, but aggressive about my stage 2 buying.

If SPX goes back UNDER its 150, then its a whole new story......

Happy Trading.

I think what I've taken from listening to the interviews and reading various GTA samples is that he has a much longer time horizon than the majority of people on here and hence focuses on long term investing and isn't interested in trading per se. I agree it was a false breakdown to Stage 4A and felt the call was very early myself as from the examples I've created from his GTA newsletter I only had it moving into Stage 3, and posted the week before the breakdown that it was in Stage 2B-. But as I've since learnt, the call was more broad and wasn't based solely on the S&P 500, but on all of the major US indexes together and was made due to his various gauges like the momentum index breaking down as well. Some of these have rebounded with the stock markets recent rally, but others haven't and continue to show large negative divergences with the price action. One thing he said in his reply to my friends email was that it doesn't matter whether it's Stage 3 or Stage 4A, but that it's far more important to get that it's a time to be defensive, which it's seems like you are to a certain extent, even though you say you being aggressive with your Stage 2 buying, as you have open both long and short positions.

Attached is my chart with a markup of the larger Stage 3 I see developing, following the failed 4A breakdown. I have the top of the Stage 3 range set to the September high currently, as we are yet to put in a more recent swing high. But once we do, I will adjust it to that point.

Cumulative volume continues to be on a weekly sell signal (below it's 9 week MA), the 30 week MA has been very flat for months, but has ticked up slightly the last few weeks, and relative performance versus the 30 year Treasuries is only slightly positive. The price action is testing the downtrend line today, so will be interesting to see if it can put in a lower high here.
 

Attachments

  • SPX_weekly_12_12_12.png
    SPX_weekly_12_12_12.png
    161.1 KB · Views: 330
Last edited:
Great to hear all the thought processes going on here, thanks and much appreciated.

I am tending towards Rewardz's false break down assumption please see attached chart.

Went short the DJI today for short term trade though, who knows, could end up a position trade.
 

Attachments

  • $NYAD.png
    $NYAD.png
    47.4 KB · Views: 371
Last edited:
Great to hear all the thought processes going on here, much appreciated.

I am tending towards RewardZ's false break down assumption please attached chart.

I did a post about that very chart earlier today on the Market Breadth thread here: http://www.trade2win.com/boards/technical-analysis/147476-market-breadth-19.html#post2032648

The higher high breakout has happened during the last two consolidation periods, and has been followed quickly by a sharper sell-off than the initial sell-off. So my question was will it happen again or is it different this time?

attachment.php


Also here's the Advance Decline Momentum Index and Advance Decline 10 Day MA Oscillator to give a different perspective to the same data. The Momentum Index (red line) shows a large divergence with S&P 500 price action (light grey line) during the recent rally.

attachment.php


One final set of charts is the Advance Decline Volume Data. The top chart is the Cumulative NYSE Advance Decline Volume divided by the NYSE Primary Market Total Volume. The second chart is the 200 day moving average of the Advance Decline Volume data (volume momentum index), and finally the third chart is Advance Decline Volume 10 Day MA Oscillator.

attachment.php
 

Attachments

  • NYAD_Weekly_11-12-12.png
    NYAD_Weekly_11-12-12.png
    32.2 KB · Views: 1,512
  • momentum_index_12_12_12.png
    momentum_index_12_12_12.png
    41.8 KB · Views: 1,513
  • AD_volume_index_12_12_12.png
    AD_volume_index_12_12_12.png
    49.5 KB · Views: 1,518
Last edited:
Top