isatrader
Senior member
- Messages
- 2,965
- Likes
- 136
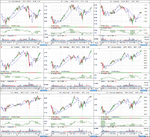
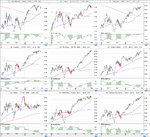
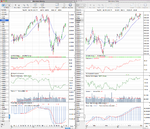
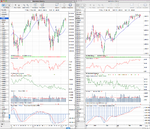
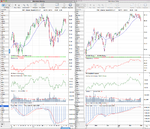
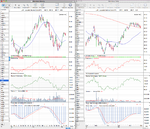
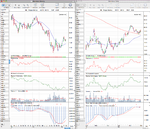
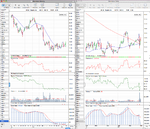
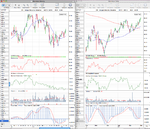
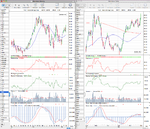
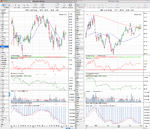
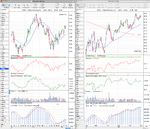
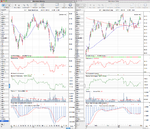
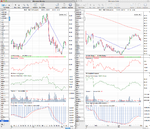
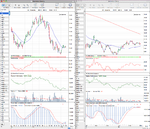
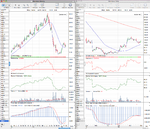
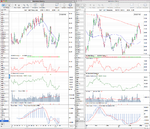
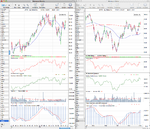
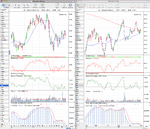
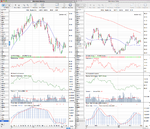
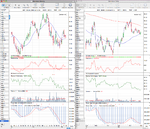
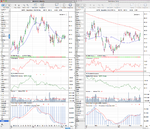
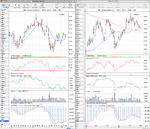
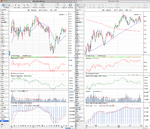
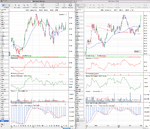
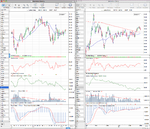
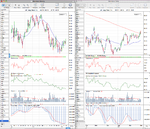
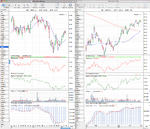
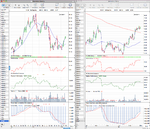
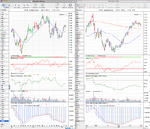
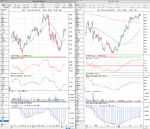
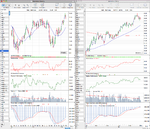
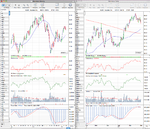
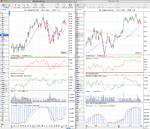
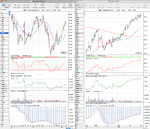
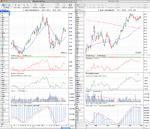
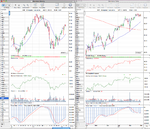
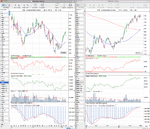
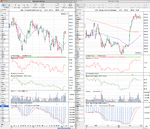
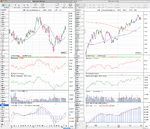
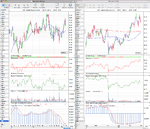
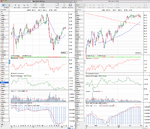
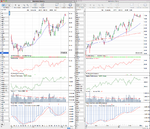
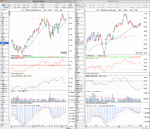
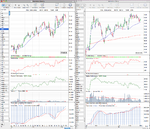
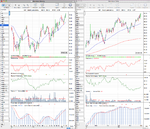
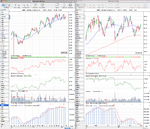
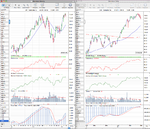
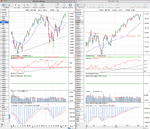
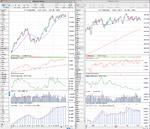
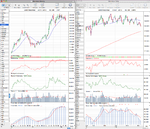
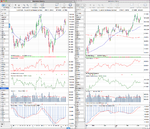
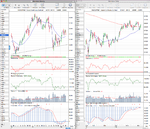
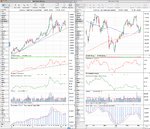
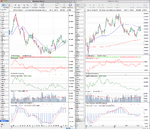
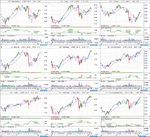
Stage 2A - examples
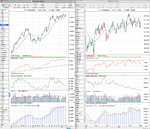
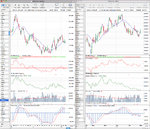
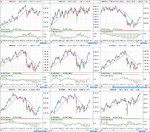
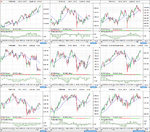
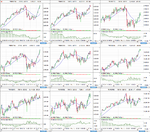
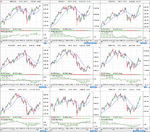
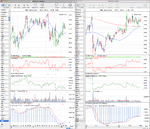
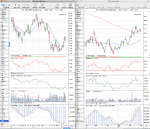
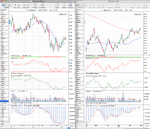
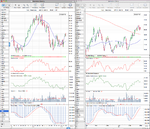
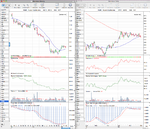
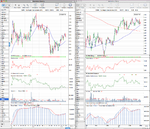
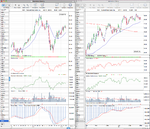
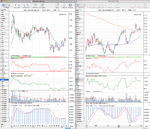
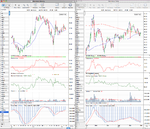
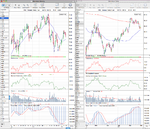
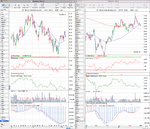
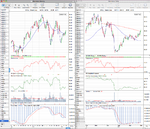
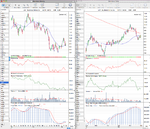
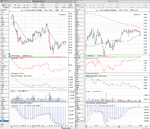
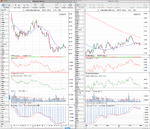
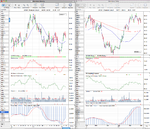
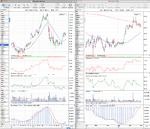
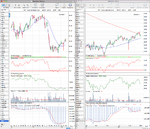
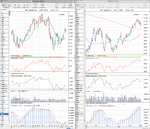
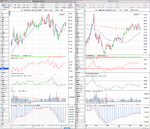
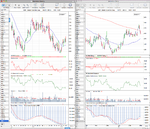
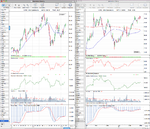
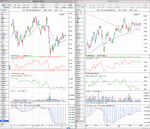
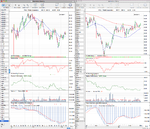
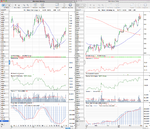
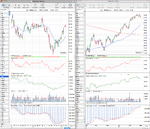
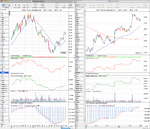
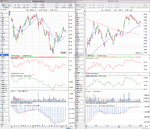
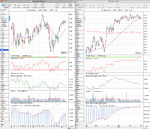
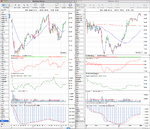
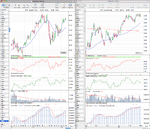
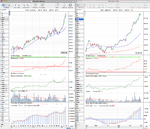
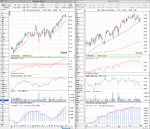
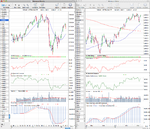
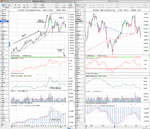
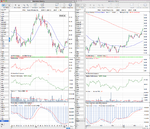
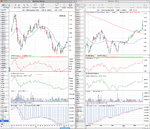
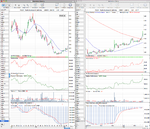
Here's some new Stage 2A examples recommended in a recent GTA report for you to look through and which are moving from Stage 1B (late in the basing phase) into Stage 2A (early in the advancing phase). I've added the 50 day and 200 day simple moving averages to the daily chart to help as well, as as you can see, it's clear the stock needs to be trading above the 200 day MA and then breakout to become Stage 2A, so the breakouts that look good below that would still be in Stage 1 by my interpretation.
I'm going to try to get hold of more back issues of the GTA report so I can build a decent database of the Stages examples for us to reference. To see the previous examples of all the Stages I posted last year, go to page 3 on thread here: http://www.trade2win.com/boards/technical-analysis/134944-stan-weinsteins-stage-analysis-3.html#post1695880
Attachments
Last edited: