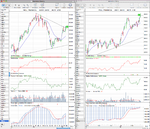
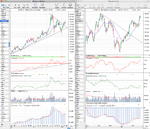
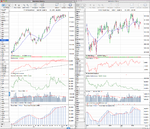
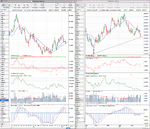
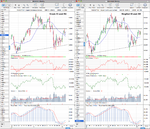
isa Thanks for this analysis and the charts. Your chart clearly shows that the June 2010 b/o to stage 2 was a lot neater and more textbook than what is going on now. (I think there was some talk of oil company takeovers back then, unlike so much now.) It does make me wonder if it is better to select the neat breakouts rather than messy ones.. . . I think PMO.L is a great example of stage analysis and some people might argue that the Stage 2 breakout has already occurred back in January when it broke above the 3 month range and 384.10 high that formed between October and December. However, the range formed below the 30 week simple MA, so is not a valid Stage 1 imo, as the price needs to form a high above the 30 week MA. . . . breakout into Stage 2 imo if it can close the week above 446.90
Nevertheless, the actual breakout in the second week of Jan 2012 did occur above a rising 30wk wma. Page 118 refers.
Premier Oil does look strong, though is inevitably vulnerable to a pause in the crude price rise.
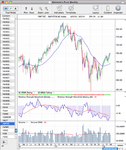
PMO.L - SharpCharts Workbench - StockCharts.com