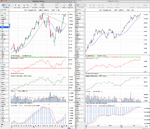
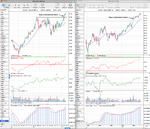
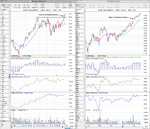
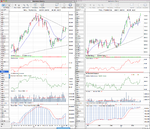
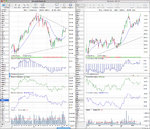
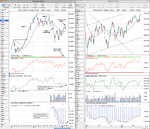
Stan Weinstein's Stage Analysis

thats wha i thought. does anybody here have any experience in cfd's?

Ypu have to be a good trader ang big monet to try to win a lot of money, but you also have to be prepare to lose it. When they started i tried but it wasnt for me.... You have be in front of the screen and place well the stops.

You do mostly need a lot of money to trade CFDs in the UK. But I trade them through CMC Markets which enable you to use fractional position sizes and fully adjustable leverage via their Tracker platform, so the cost is much lower than other CFD brokers and it's fully accessible to retail traders with limited capital as you can use very precise position sizing. Here's the link: Fractional CFD trading | CMC Markets. Give the demo a go so you can see if it's what you want.

Ok, lets get back on topic now please as I want to keep the thread focused on discussing Weinstein's method. Use private messages for any off topic stuff if you can please.
 
i see the nasdaq100 futures is hitting the resistance

That's ok, as my position in the Nasdaq 100 is in my portfolio using Weinstein's investor method, whose aim is to capture the majority of a Stage 2 move and isn't exited until it either reaches my target or moves into at least Stage 3A. But should be fully exited at the Stage 4 breakdown. Which is a long way off yet imo, as we haven't even had the first pullback yet and possible continuation pivotal point which would give me the opportunity to move my stop up and possibly add to the position size on the continuation breakout. This might not happen and the first pullback might be more than just pullback, but then my stop loss would get me out.

Weinstein's investor method isn't about trying to pick tops or bottoms. It's about entering a trade at the Stage 2 breakout point and then sitting through the momentum part of the uptrend, gradually raising your stop below the 30 week moving average after each significant pullback so that you capture a large portion of the uptrend and are forced to exit at least part of your position by your stop loss when the Stage 2 phase ends.

For the Nasdaq 100 I have a measured move target of 2850, so following the method I could take partial profits at my target if it reaches it and then use the rising stop loss to exit the remaining position when it eventually gets hit as the Stage 2 phase ends.
 
Hi isatrader,

thanks and I love the way you follow Weinstein.
By the way could one leverge using Weinstein method? It seems risky, isn't it because of riding such a big wave.
 
By the way could one leverge using Weinstein method? It seems risky, isn't it because of riding such a big wave.

Thanks incrediblefx, I think a sensible way that you can leverage using the method is to add to your position on continuation breakouts as that's the point where you raise your stop loss on the investor positions. You would however still need to be careful that the total position size (if it gaped past your stop loss) didn't exceed your maximum risk tolerance.

Another option, might be to hold a core position in a stock using the investor method and then trade a further position at the same time using the trader method, so trying to capture the smaller moves within the Stage 2 phase as well.
 
isatrader,

I like the concept of Stan and I find it very useful.
But I'm not an investor type so I probably trade only like a trader as described in his book.
I feel it takes too long for me to ride entire phase 2.
 
Hi All,
This is my first post :)
I just finished the book and I found it very helpful.
I just got a question about Chapter 8 Long-term indicators such as Advance Decline Line indicator and Momentum index. I am using MetaStock and I can only find NSYE Advance/Decline line which is not useful for me as I use ASX Market.
So I was wondering if anyone successfully using these indicators ?

Thanks!
 
isatrader,
I like the concept of Stan and I find it very useful.
But I'm not an investor type so I probably trade only like a trader as described in his book.
I feel it takes too long for me to ride entire phase 2.

No worries incrediblefx, everybody has to trade the way that suits them personally. My focus at the moment is forward testing and studying the investor method. I'm trying to approach it as an in-depth study so that I can fully understand it and hence trade it properly. The majority of the information in the book is on the investor method, so although I plan to start testing the trader method very soon also, I feel that I need to spend more time trying to gather information on the trader first as it will require much more research time each day, which I don't currently have due to my work commitments at the moment.
 
Last edited:
Hi All,
This is my first post :)
I just finished the book and I found it very helpful.
I just got a question about Chapter 8 Long-term indicators such as Advance Decline Line indicator and Momentum index. I am using MetaStock and I can only find NSYE Advance/Decline line which is not useful for me as I use ASX Market.
So I was wondering if anyone successfully using these indicators ?

Thanks!

Hi amiraljaberi, thanks for joining in. The Long-term indicators such as Advance Decline Line indicator and the Momentum index are meant to be used for secondary confirmation only. Don't worry too much about them, just check in with them from time to time to help add weight to your evidence on what stage the market is at. It doesn't matter that you are trading the ASX too much, as the correlation between the major markets is quite high. So although the ideal would be to use the advance decline data from the entire Australian market, you should get a relatively similar picture from the entire NYSE. But for the most accuracy in your case I'd try to find the advance decline data from the entire Australian market.
 
hey guys, quick question on buying. do you think that it is best to us a daily or weekly chart to time a buy crossing resistance?
 
hey guys, quick question on buying. do you think that it is best to us a daily or weekly chart to time a buy crossing resistance?

It depends on whether you are using the trader method or the investor method as the Stage 2 breakout point is the same whether you use a daily or a weekly chart. But focusing in on the daily chart after you've identified the stage and breakout level on the weekly chart is probably the best way to go if you are using the trader method. But if you are using the investor method you can stick to the weekly charts imo.
 
I opened a trade in Caterpillar (CAT) at 115.85 today, as it triggered my Stage 2 alert yesterday that I'd set up previously, but it didn't close well yesterday so I waited to see what the price action was like today before getting in. I've set my stop loss under the last significant low at 109.83. So am risking 2 x the 200 day average true range, which is 0.5% of my account. This is a trader position, not an investor one. Here's the charts
 

Attachments

  • CAT_weekly_22_2_12.png
    CAT_weekly_22_2_12.png
    117.2 KB · Views: 355
Hi Isa

I just wanted to thank you for what I think is the most valuable thread currently active n T2W. I bough Weinstein's book last week (I had known of it for years but had been put off by the cheesey cover). Its a very vuseful reminder that following simple price action is the easiest way to secure profits.

A lot of what Weinstein says echoes Justin Mamis's books "How to buy" and "when to sell" but these are even more dated and are also quite hard to find.

I don't want to distract from your analysis by posting my trades but Qualcomm is showing a continuation breakout at the moment.I went long a week ago. Volume initially looked encouraging but tailed ff quite quickly though which is a concern.

QUALCOMM Incorporated Stock Chart | QCOM Interactive Chart - Yahoo! Finance
 
Hi Isa

I just wanted to thank you for what I think is the most valuable thread currently active n T2W. I bough Weinstein's book last week (I had known of it for years but had been put off by the cheesey cover). Its a very useful reminder that following simple price action is the easiest way to secure profits.

A lot of what Weinstein says echoes Justin Mamis's books "How to buy" and "when to sell" but these are even more dated and are also quite hard to find.

I don't want to distract from your analysis by posting my trades but Qualcomm is showing a continuation breakout at the moment.I went long a week ago. Volume initially looked encouraging but tailed ff quite quickly though which is a concern.

QUALCOMM Incorporated Stock Chart | QCOM Interactive Chart - Yahoo! Finance

Hi atters88, thanks for posting and I appreciate the kind words. I've attached my charts of QCOM for you to help you relate to what you've seen in the thread. The Stage 2 breakout was on the 2nd February when it gaped above the last years high of 59.84 and it's performed fairly inline with the S&P 500 since then. Since the October low it's outperformed the S&P 500 by around 5%, the tech sector by just over 4% and is trading fairly inline with it's sub sector. The Mansfield relative strength is positive, but as you noted the volume has weakened since the breakout so is the one negative on the charts to watch currently imo.

But you've picked an outperforming stock, in a strong sector only a little bit after it's breakout. So you're on the right track imo.
 

Attachments

  • QCOM_weekly_22_2_12.png
    QCOM_weekly_22_2_12.png
    118.7 KB · Views: 406
  • QCOM_weekly_RS_22_2_12.png
    QCOM_weekly_RS_22_2_12.png
    121.1 KB · Views: 326
Hi amiraljaberi, thanks for joining in. The Long-term indicators such as Advance Decline Line indicator and the Momentum index are meant to be used for secondary confirmation only. Don't worry too much about them, just check in with them from time to time to help add weight to your evidence on what stage the market is at. It doesn't matter that you are trading the ASX too much, as the correlation between the major markets is quite high. So although the ideal would be to use the advance decline data from the entire Australian market, you should get a relatively similar picture from the entire NYSE. But for the most accuracy in your case I'd try to find the advance decline data from the entire Australian market.

Thanks Isa. Appreciate ur help.
 
I was reminded today by a friend of a watchlist pick that I've been following for a few months in the Oil & Gas Producers sector. Premier Oil (PMO.L) is very close to a Stage 2 breakout this week and made a new high today, but pulled back from it quickly. So instead of entering straight away, I've setup a buy stop order for the 448 to 448.50 range with my broker so that I get in if it pivots and moves higher again in the coming days.

I think PMO.L is a great example of stage analysis and some people might argue that the Stage 2 breakout has already occurred back in January when it broke above the 3 month range and 384.10 high that formed between October and December. However, the range formed below the 30 week simple MA, so is not a valid Stage 1 imo, as the price needs to form a high above the 30 week MA. I personally use the 30 week weighted MA on my charts as I mentioned before, which is a bit more sensitive to recent prices so the 384.10 high was slightly above that, but the Oct to Dec range was a 4B range imo. So the January move up to the previous resistance level around 450 and small pullback has now set it up to be able to breakout into Stage 2 imo if it can close the week above 446.90

Here's the charts
 

Attachments

  • PMO_weekly_23_2_12.png
    PMO_weekly_23_2_12.png
    122.6 KB · Views: 367
  • PMO_weekly_RS_23_2_12.png
    PMO_weekly_RS_23_2_12.png
    122.2 KB · Views: 332
Last edited:
i havent posted much here recently as a) for some reason it hasnt sent me email updates of new posts, and b) i have deviated from classic weinstein to a much shorter term version with a few tweeks..
re volume - for 95percent of my trades in uk i ignore volume as its not really representative. we have things like delayed trades etc etc etc, so it doesnt give a true reflection, and as isa said the uk mkt is much more illiquid than usa.. on a share like gkp which im in it is valid as the volumes can be very high..

GKP is a great example as the volume increased on the initial breakout to 300 and then contracted in the two week pullback following that before breaking out again on stronger volume to push up above 450, so it made 123% gain from the stage 2 breakout at 201.5 in late Dec/early Jan and is currently still up 82.7% at 368.25.

UK banks is another area that has decent volume, so can be looked in the proper way. The UK banking sector (^NMX8350) is currently in Stage 1A.
 
Palladium (PA) Update

Palladium (PA) was one of the first charts I marked up in the thread back in September 2011 (Here's the link to the post: http://www.trade2win.com/boards/technical-analysis/134944-stan-weinsteins-stage-analysis-2.html#post1681460) when I noted the Stage 4 breakdown when it crossed below 700 after making a large Stage 3 top for most of 2011 up until that point. I still follow the precious metals every week and yesterday they all made moves into new sub-stages, but I want to focus on Palladium first as the Stage analysis is the clearest.

Palladium's stage 4 reached the measured move target of 550 within 3 weeks of it's breakdown and then consolidated below the 30 week WMA until January when it finally broke higher again to retest the 700 breakdown level for the first time and move into Stage 1A. It formed a short term top and pulled back towards the 30 week WMA and previous support in the 680-690 range over the last few weeks. However this week has seen some volume return and it's had three up days which have pushed it to a new high and confirmed the new Stage 1 for me.

It has a lot resistance to work through to reach the previous high of 858, but it's making the right moves to go higher again and reach a new Stage 2. So might be of interest to the more short term traders on the thread. Silver is making similar moves and is back in Stage 1A, but I'll mark up that chart when I have some more time.

Attached is the marked up Palladium chart
 

Attachments

  • PA_weekly_23_2_12.png
    PA_weekly_23_2_12.png
    133.3 KB · Views: 275
I got filled on my Premier Oil trade at 448.01 at the open today. However, that was because the market maker opened the stock above the breakout level and it immediately moved back towards yesterdays close, so I'm not impressed with the entry particularly. This is the liquidity problem with UK stocks that we talked about before as it's easier for market makers do outsized moves on the open to soak up orders due to the lower volumes in the stocks and why I tend to trade UK stocks less as it makes placing limit and stop loss orders more difficult.
 
Top